Usman Akram
Study Parameters
Parameter | Value |
|---|---|
The question | How much have AI Overviews cut organic CTR, and is the drop growing, holding steady, or easing off across 2024, 2025 and 2026? |
Method | A meta-analysis. We ran no crawl of our own. We read what everyone else published and put it in one place. Every number has a named source. |
What's in it | 39 studies from 2024 to mid-2026 (11 from 2024, 18 from 2025, 10 from 2026). |
Main lens | Position-1 CTR, plus the rest of the first page where studies report it. |
Where | Mostly the US, with Germany and the EU where they add something. |
The one rule | We only average numbers that measure the same thing. A Pew figure never gets mixed with an Ahrefs figure to make one headline. |
The numbers are checkable. What they mean is our read, and we keep the two apart throughout.
Executive Summary
Search people already agree on the basics: when an AI Overview shows up, fewer people click the links. That's settled. The open questions are how big the drop is, whether it's still growing, and who it hits, and those answers are less obvious than the headlines.
So we pooled 39 first-party studies published since the May 2024 launch. Across the fifteen studies that measure a comparable drop, the middle figure is about 47.5%, roughly half the clicks. The cleanest number comes from Ahrefs, which ran the same 300,000-keyword test a year apart and saw position-1 losses go from 34.5% to 58%.
The shape of the drop matters more than the size. It was near zero at launch, got much steeper through 2025, and looks like it's flattening in early 2026. Seer's tracking even shows organic clicks rising again in the first months of the year. Too early to call a bottom, but the data does not show an endless fall.
Two findings cut against the doom story. Branded searches actually gain clicks when an AI Overview appears. And pages named inside the AI Overview end up better off than before. The damage lands on pages that rank well but get left out of the answer.
The table below is the whole report at a glance. Each module then shows the working.
What we asked | What the data says |
|---|---|
Is the drop real? | Yes, and nobody disputes it. Every one of the 15 comparable studies points down. |
How big at position 1? | 34.5% in early 2025, up to 58% by the end of the year: same test, same company. |
Is it still getting worse? | It got steeper through 2025, then started to flatten in early 2026. |
Does it hit everyone? | No. Branded search gains (+18.7%); non-branded loses (−20% to −37%). |
Any way to win? | Yes, get cited inside the AI Overview and you end up ahead. |
Key Takeaways at a Glance
The angle | What we found |
|---|---|
The number | Roughly half the clicks go on an AIO query, middle figure 47.5%, up to 58% at position 1. |
The magnitude split | Six of the fifteen studies find losses of 50% or more. The ones measuring a single position sit highest. |
The trend | Steep through 2025, flattening in early 2026, not an endless slide. |
The spread | Numbers run 15% to 61%. That range is mostly about what each study measured, not real disagreement. |
Who's safe | Branded search gains clicks. Strong brand demand is quiet protection. |
Who's exposed | Non-branded, informational, below-the-fold pages, and anything left out of the answer. |
The one bright spot | Being cited inside the AI Overview turns the loss into a gain (+22% to +35% vs a normal #1). |
The honest caveat | The 2026 and international numbers are still thin. Treat the flattening as an early signal, not a promise. |
How to Read This Report
Every module answers one plain question. The table gives the numbers, the chart gives the shape, the shaded box gives the practical read. Each module also links the studies behind it, so you can see what backs each claim.
Module | The question it answers |
|---|---|
1. The top result | How much does a #1 ranking actually lose, and does the whole page suffer? |
2. The magnitude | How big is the drop really, and why do the numbers range so much? |
3. The trend | Is it still getting worse, or has it started to level off? |
4. Forecasts | Did the 2024 predictions match what actually happened? |
5. Branded vs not | Does it hurt everyone, or are some queries safe? |
6. Hardest hit | Which query types and industries lose the most? |
7. The bright spot | If you're cited inside the answer, do you escape the drop? |
One thing to keep in mind. These studies measure different things. Ahrefs measures the CTR of a single position. Seer measures it per query. Pew watched real people browse. Authoritas looked at publisher traffic. Four windows onto the same event. We compare them, but we never average them into one number.
Methodology
What we included
Original, first-party research measuring AI Overview click impact, published between the May 2024 launch and mid-2026. We left out posts that only re-quote other people's numbers. Where a company ran the same study more than once, Ahrefs twice, Seer three times, we treat it as one series over time, so a single method can't vote twice.
How we lined the numbers up
We turned every headline into a plain percentage drop against whatever baseline that study used. Where a study gave raw CTRs, like Seer's 1.76% down to 0.61%, we worked out the relative fall and kept both. Baselines differ, some December 2023, some March 2024, and we recorded that instead of pretending they match.
How we averaged, and what we held back
We pool numbers only inside the same measurement family, and report the middle value and range with a study count. Where a family has fewer than three studies, we call it directional, not firm. Forecasts and "how often AIOs appear" figures are context only and never enter a drop average. Before writing, we re-read the sources behind the main trend to check the numbers.
Module 1: How Much the Top Result Actually Loses
Start with the cleanest test anyone has run. Ahrefs took 300,000 keywords, split them into ones that trigger an AI Overview and matched ones that don't, and compared the CTR of the #1 result. Then it ran the same test a year later. Holding the position fixed is the fairest way to isolate what the AI Overview does.
When | #1 CTR drop with an AIO | Source |
|---|---|---|
May 2024 (launch) | ~0% | Siege Media, no drop at first, if anything a slight lift |
Early 2025 | 34.5% | Ahrefs, 300k keywords |
End of 2025 | 58% | Ahrefs, same 300k test |
Early 2026 (Germany) | 59.3% | SISTRIX, 100M+ German keywords (27%→11%) |
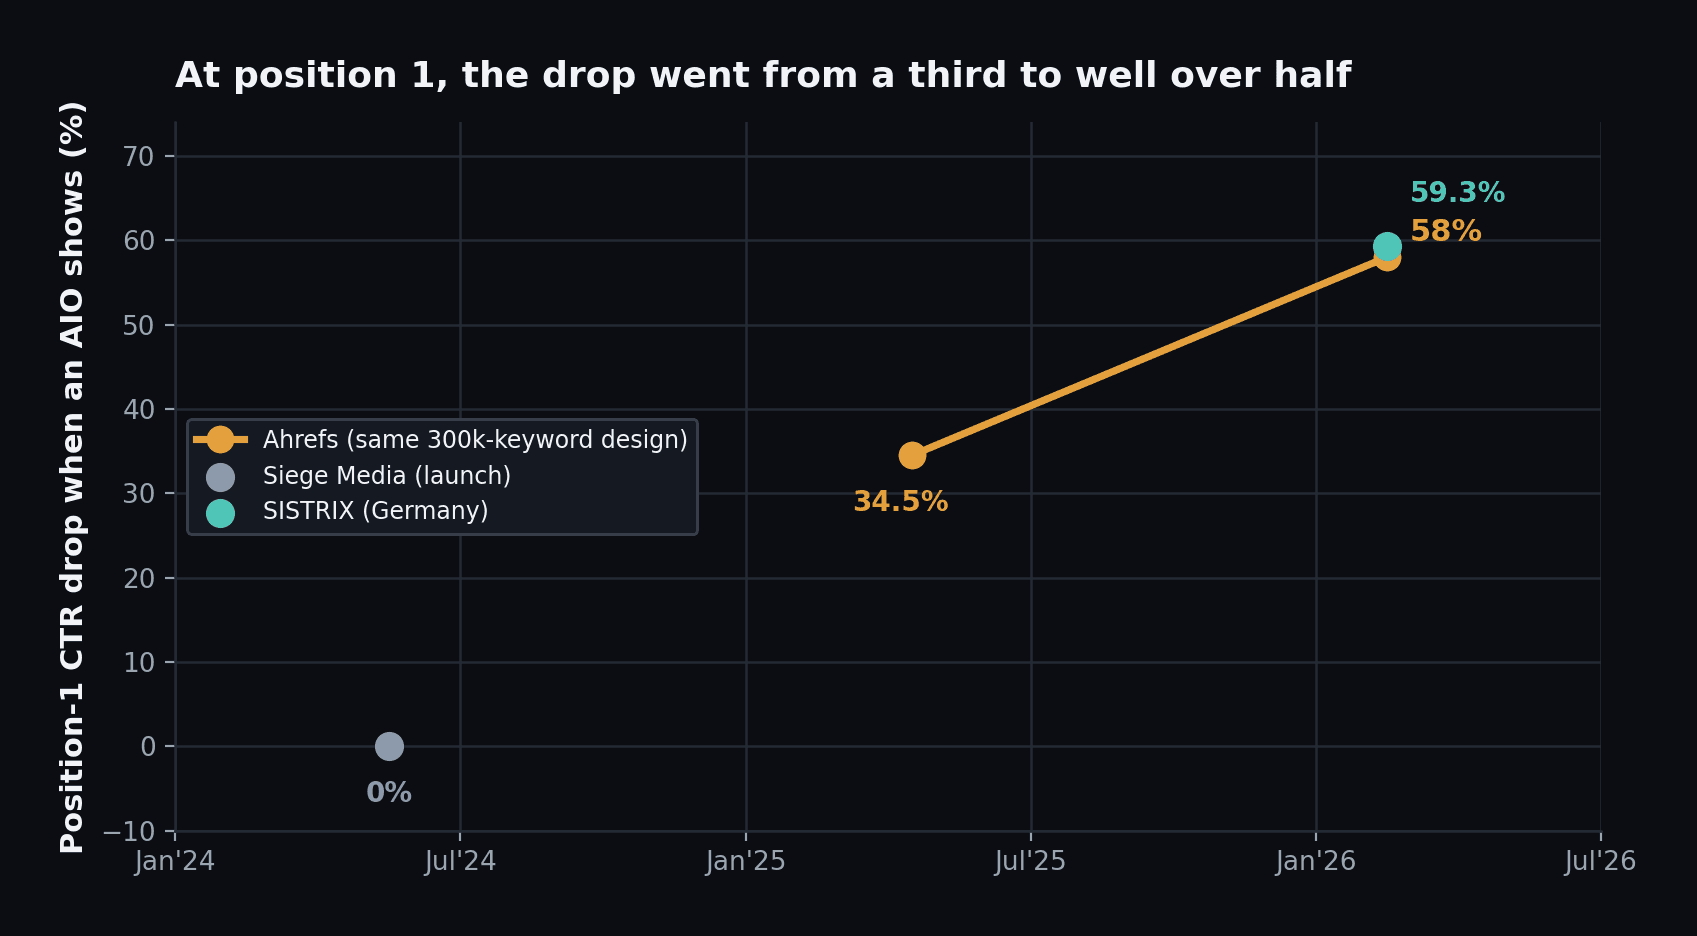
Figure 1: Position-1 CTR drop over time. Nothing at launch, a third by early 2025, well over half by the end of the year.
It isn't only the top spot. Further down the page, Ahrefs found position 2 giving up about half its clicks and position 10 down nearly 20%. seoClarity saw it too: the top two spots roughly held on desktop while position 3 halved. The deeper you rank, the worse it gets.
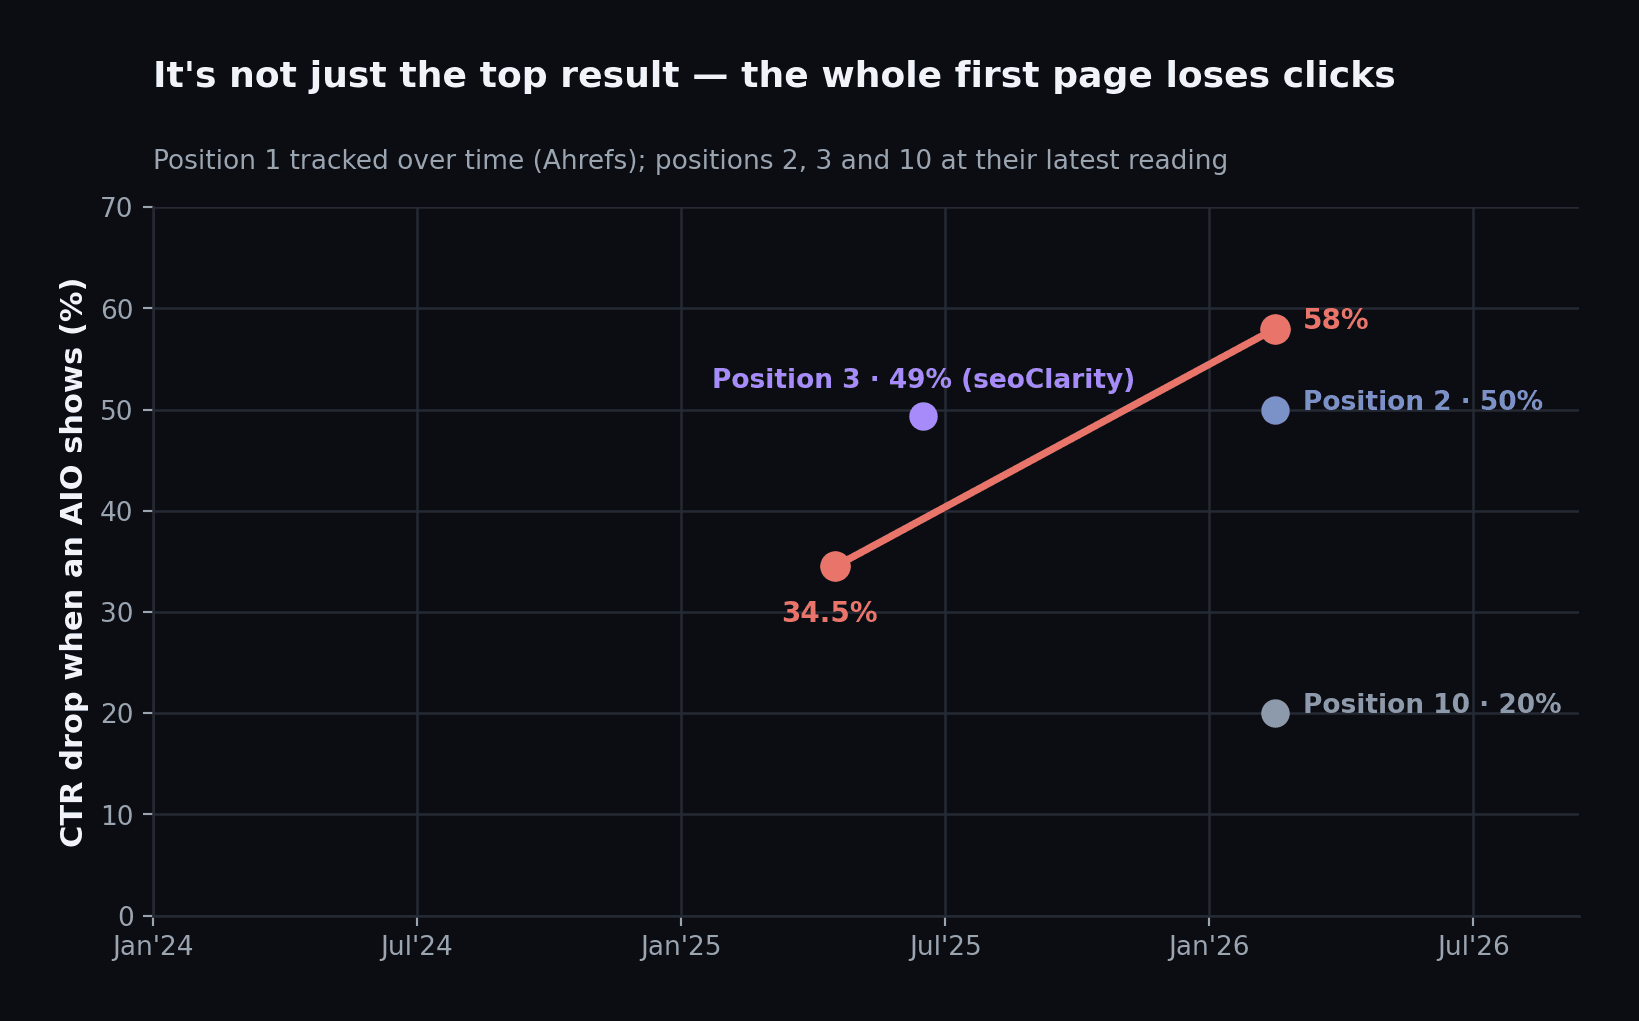
Figure 2: Position 1 tracked over time, with positions 2, 3 and 10 at their latest readings. The losses reach all the way down the page.
A #1 ranking now loses most of its clicks. At 58%, more than half the clicks a top page used to get vanish the moment an AI Overview appears.
It roughly doubled in eight months. The same Ahrefs test went from 34.5% to 58%, the clearest sign that 2025 was the year this bit.
The whole first page feels it. Positions 2 through 10 all lose clicks, and pages just below the fold lose the most.
What this means for youRanking first isn't the finish line it was. On a query with an AI Overview, a #1 spot brings in about half the traffic it used to, and mid-page is worse. You still need to rank. You just can't assume the clicks follow. |
Studies Behind This Module
Ahrefs: AI Overviews Reduce Clicks by 34.5% (2025) (Click here).
Ahrefs: Update: AI Overviews Reduce Clicks by 58% (2026) (Click here).
Siege Media: AI Overviews SEO Impact Report (Click here).
SISTRIX: German-market AI Overviews CTR study (Click here).
seoClarity: AI Search Trend Report (position-level CTR) (Click here).
Slate: Tech CTR Benchmarks 2026 (4.5M impressions) (Click here).
Module 2: How Big Is the Drop, Really?
One study is easy to argue with. Fifteen studies from different companies using different methods are not. So the useful question isn't whether clicks fell, but how far: and why the published numbers vary so much.
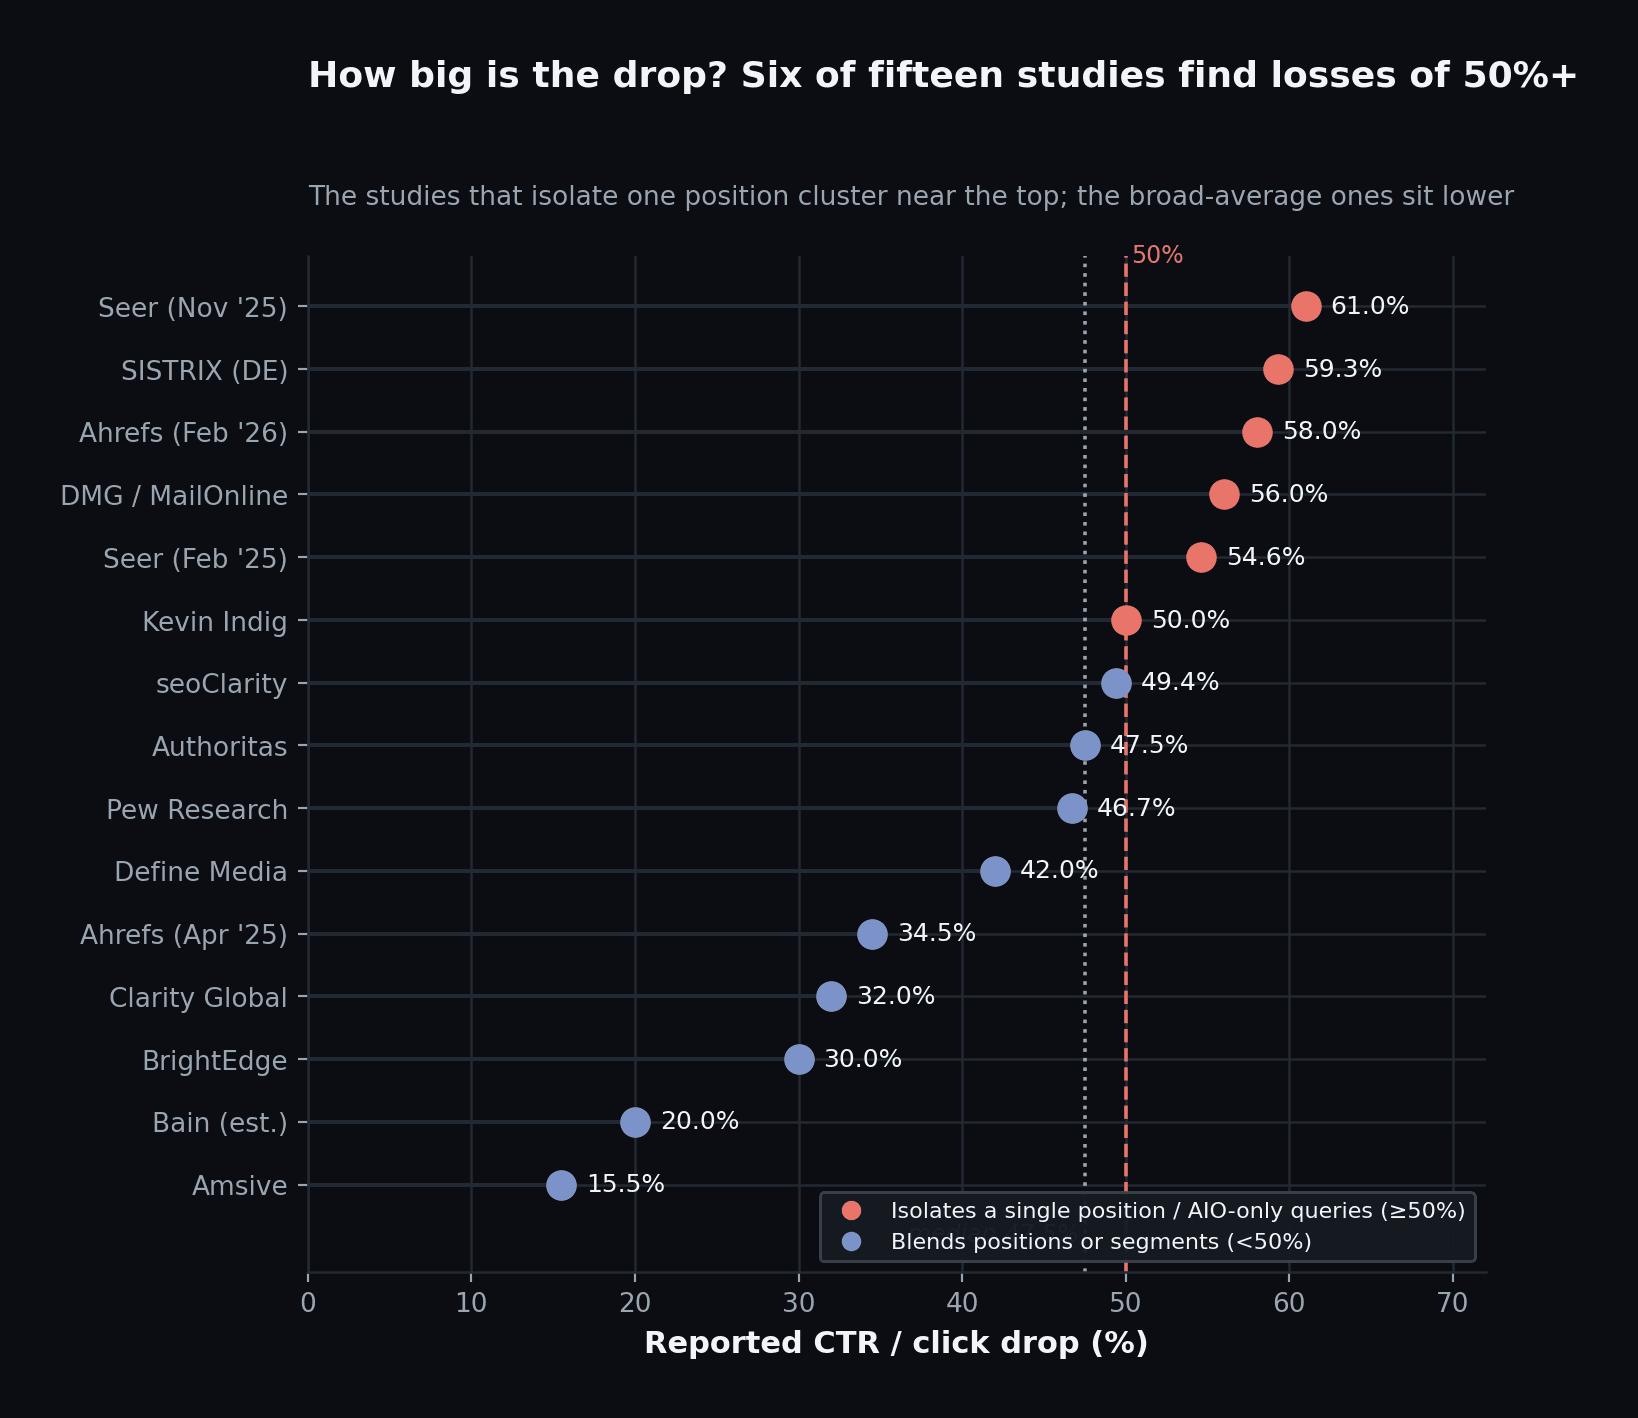
Figure 3: The fifteen comparable studies, smallest drop to largest. Six land at 50% or more; the middle of the pack sits at 47.5%.
The 15%-to-61% spread looks like disagreement, but mostly isn't. The studies at the top: Ahrefs, Seer, SISTRIX, measure a single position or only AIO queries, so they catch the effect at its sharpest. The lower ones, like Amsive at 15.5%, mix branded and non-branded terms and average across all positions, which dilutes the number. Different questions, not conflicting answers.
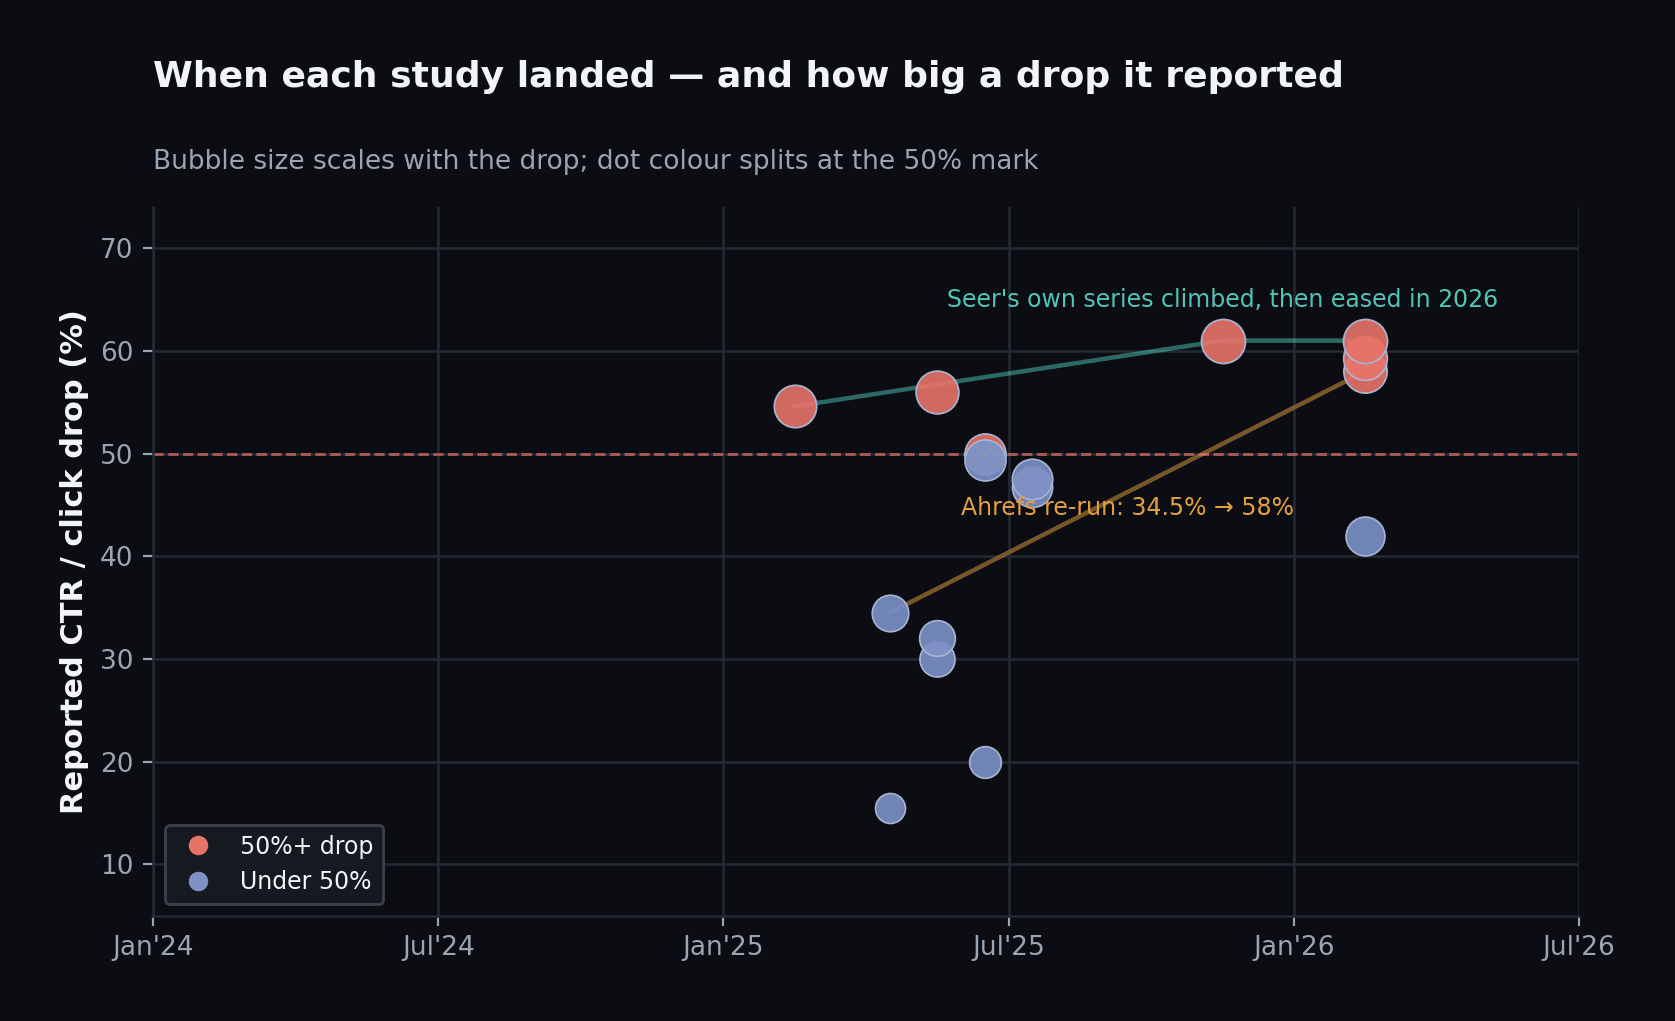
Figure 4: The same studies plotted by when they were published. Bigger bubbles mean bigger drops; the two connected lines are Ahrefs and Seer re-running their own tests.
The middle figure is about 47.5%. Half the clicks, give or take. That's the number to quote if you want one that sits fairly in the middle of the evidence.
Six of fifteen find 50% or more. The bigger losses come from the studies that measure a single position cleanly, so 47.5% is probably conservative for a #1 ranking.
Real people and SERP tools agree. Pew watched actual users: an 8% click rate with an AIO versus 15% without, about a 47% fall. Two very different methods landing in the same place is hard to dismiss.
What this means for youA user panel, a 300,000-keyword crawl, and a publisher's server logs all land near "half the clicks gone." That's no longer a vendor talking point; it's the consensus. Quote the number that matches what you measure, but plan around 40–60%. |
Studies Behind This Module
Ahrefs (2025 & 2026): AI Overviews Reduce Clicks: original and update (Click here).
Seer Interactive: AIO Impact on Google CTR (Sept 2025 update) (Click here).
Pew Research Center: Do people click links in Google AI summaries? (Click here).
Amsive: Google AI Overviews CTR study (700k keywords) (Click here).
Authoritas: AI Overviews impact on UK publishers (Click here).
seoClarity: AI Search Trend Report (Click here).
BrightEdge: AI Overviews One-Year Review (Click here).
Clarity Global: How AI Overviews are impacting organic traffic (Click here).
DMG Media / MailOnline: Publisher AI Overviews traffic data (Click here).
Define Media Group: Publisher organic click trend (Click here).
Kevin Indig: AI Overviews CTR / UX study (Click here).
Bain & Company: Consumer AI search reliance (Click here).
Module 3: Is It Still Getting Worse?
Knowing the drop is big is one thing. Knowing whether it's still growing changes what you do about it. Plotting the comparable studies by the year they measured gives a rough but honest read on direction.
Year | Middle drop | What's behind it |
|---|---|---|
2024 | ~0% | Siege Media finds nothing at launch; the rest of the year is forecasts and "how often AIOs appear" |
2025 | ~47% | Eleven studies, Ahrefs, Seer, Pew, Amsive, Authoritas, Indig, seoClarity, BrightEdge and more |
2026 | ~58% | Ahrefs 58%, SISTRIX 59.3%, Define 42%, but with an early-year rebound underneath |
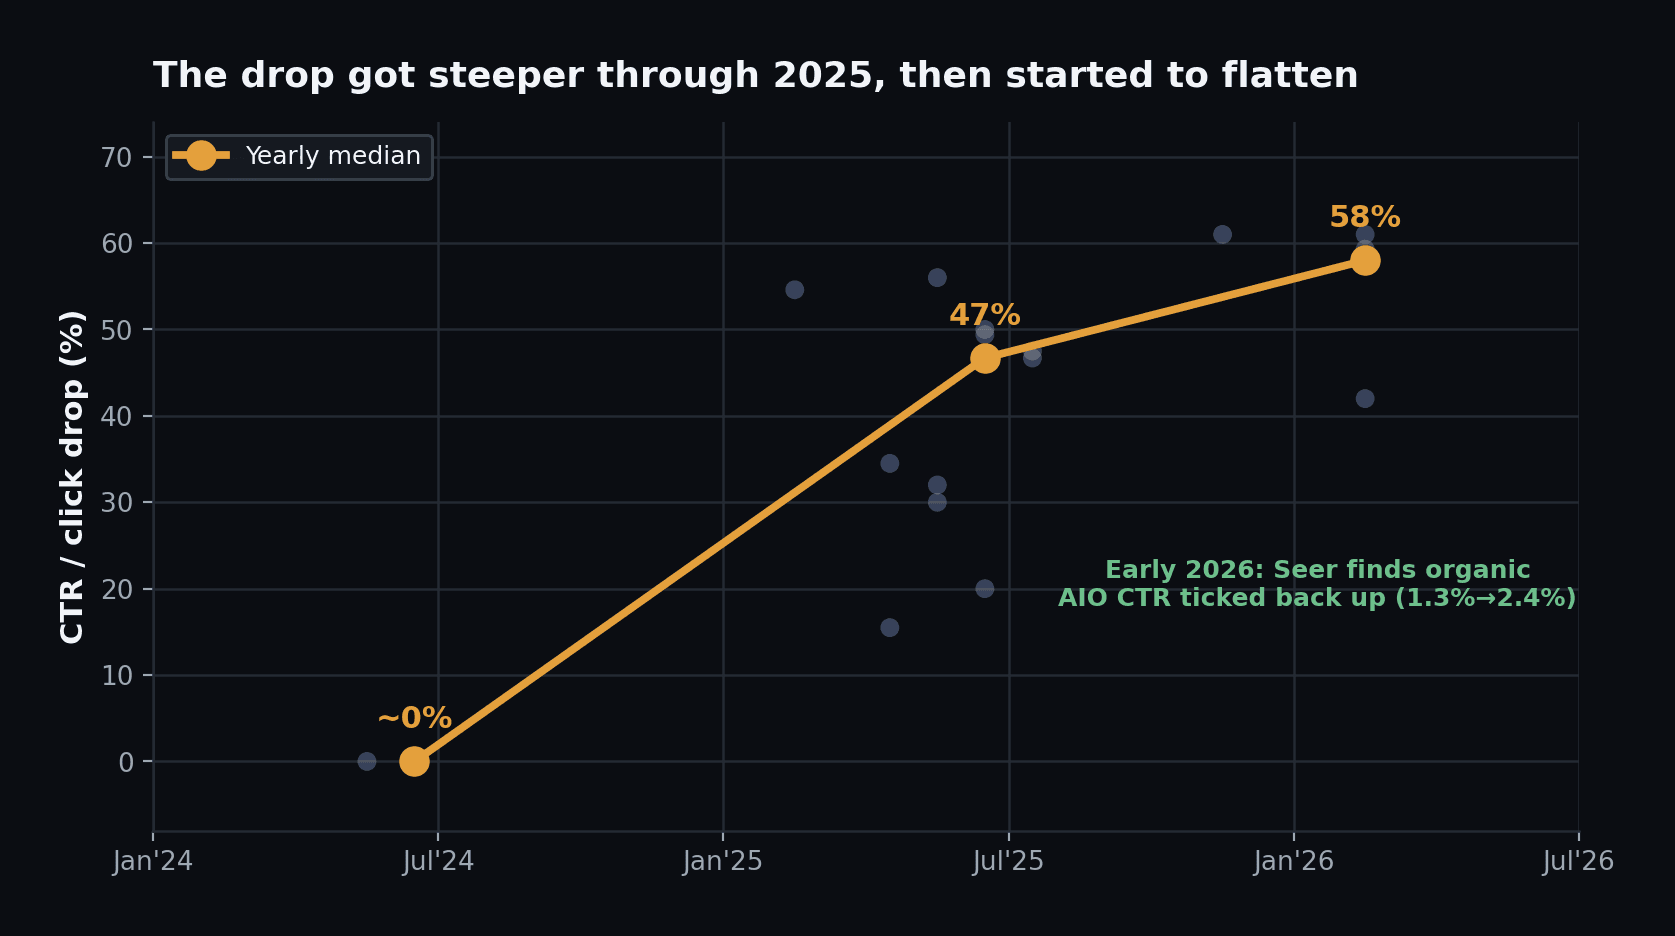
Figure 5: The drop by year. Faint dots are individual studies at the date they were published; the amber line is the yearly middle.
The flattening needs a close look. Seer's 2026 update found organic AIO click-through rose, from 1.3% in December 2025 to 2.4% by February 2026: while its alarming "−61%" headline was going around. That −61% is a cited-page number inflated by a jump in impressions, not proof of a continued fall. Read properly, Seer's data is the clearest sign the worst is behind us.
Abroad, with a catch. Germany's SISTRIX finds a 59% #1 drop and an EU study shows the same pattern, but AI Overviews only reached Germany in March 2025. Other countries look like they're climbing the same curve a year late, not a gentler one. Real evidence, but thin, so we call it a signal rather than a finding.
It got steeper, then eased. Nothing in 2024, ~47% in 2025, ~58% in 2026: but the jump into 2026 is smaller than the jump into 2025, and the best long-running tracker is rising again.
The scariest 2026 number is a mirage. Seer's −61% is an impressions artifact. The underlying organic trend is flattening, not collapsing.
What this means for youThe panic phase is probably over. The steep damage happened in 2025, and 2026 looks like a new, lower normal rather than a floor that keeps giving way. Half the clicks are still gone, but you can stop bracing for more and start building on a stable baseline. Watch other countries; they're a year behind and still rising. |
Studies Behind This Module
Siege Media: AI Overviews SEO Impact Report (2024 baseline) (Click here).
Ahrefs: AI Overviews Reduce Clicks: 34.5% then 58% (Click here).
Seer Interactive: AIO CTR 2026 update (the rebound signal) (Click here).
SISTRIX: German-market AI Overviews CTR study (Click here).
Define Media Group: Publisher organic click trend (2026) (Click here).
AISOS / SISTRIX: Cited vs non-cited AIO CTR (EU) (Click here).
Module 4: Did the 2024 Forecasts Get It Right?
Before any real data existed, 2024 was full of confident predictions. Worth checking them against what happened, to see who called it, and as a sanity check on the measured numbers.
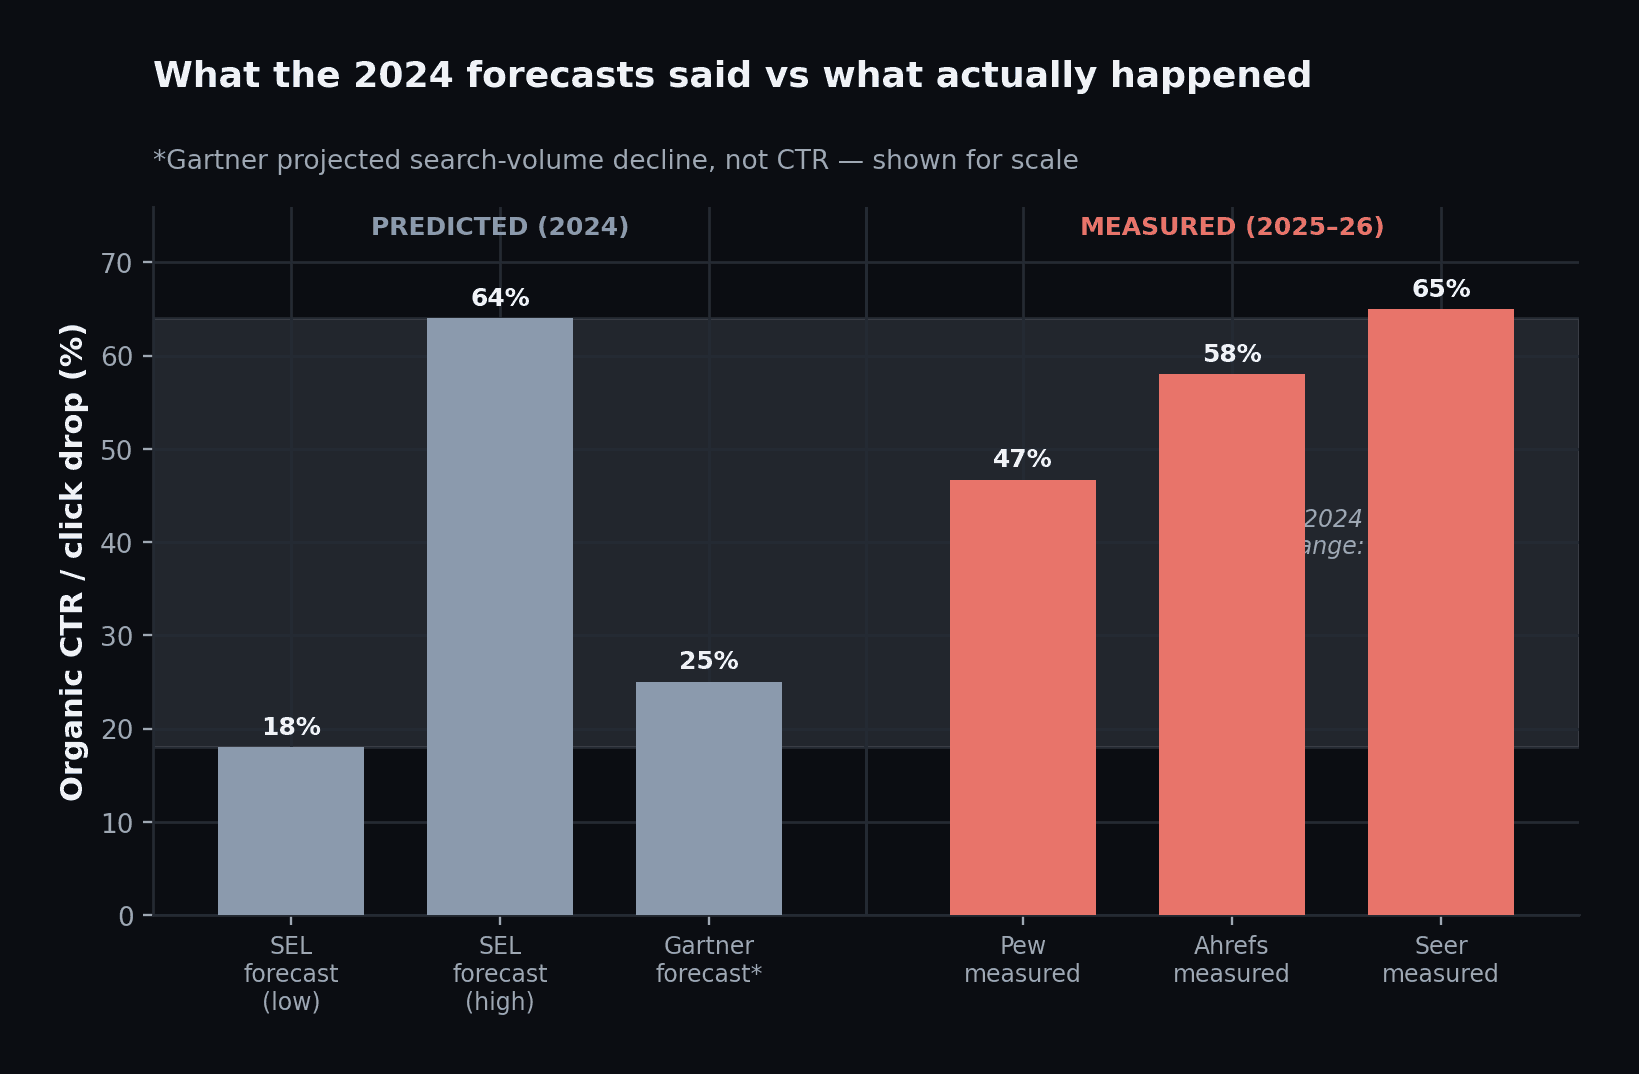
Figure 6: On the left, what the 2024 forecasts predicted. On the right, what studies actually measured in 2025–26. Reality landed in the top half of the predicted range.
The 2024 forecast | What actually happened (2025–26) |
|---|---|
Search Engine Land: an 18–64% organic click decline | Ahrefs 58%, Seer ~65%, Pew 47%, inside the range, and in its upper half |
Gartner: search volume down 25% by 2026 | Roughly on track; zero-click searches now top two-thirds |
The pessimists were basically right. The measured 47–65% drops sit inside the wide 18–64% band analysts guessed before any data existed. The "nothing will change" crowd got it wrong.
But they were wrong about the shape. The early fear was loss across the board. What happened is concentrated: brutal on non-branded informational queries, barely there on branded and transactional ones.
What this means for youThe 2024 warnings got the size right and the spread wrong. Use the same filter on today's predictions about AI Mode and agentic search: probably right on direction, probably wrong that it hits everything equally. |
Studies Behind This Module
Search Engine Land / Pilot Digital: Generative search CTR projection (2024 forecast) (Click here).
Gartner: Search volume forecast to 2026 (Click here).
Ahrefs: Update: AI Overviews Reduce Clicks by 58% (Click here).
Seer Interactive: AIO Impact on Google CTR (Click here).
Pew Research Center: Do people click links in Google AI summaries? (Click here).
Module 5: Who's Protected: Branded vs Non-Branded
The most useful split in the corpus comes from Amsive, which sorted 700,000 keywords by whether they were branded, and found the effect flips depending on which side you're on.
Type of query | CTR change with an AIO |
|---|---|
Branded (someone searches your name) | +18.68% |
Non-branded | −19.98% |
Not in the top 3 | −27.04% |
Also has a Featured Snippet | −37.04% |
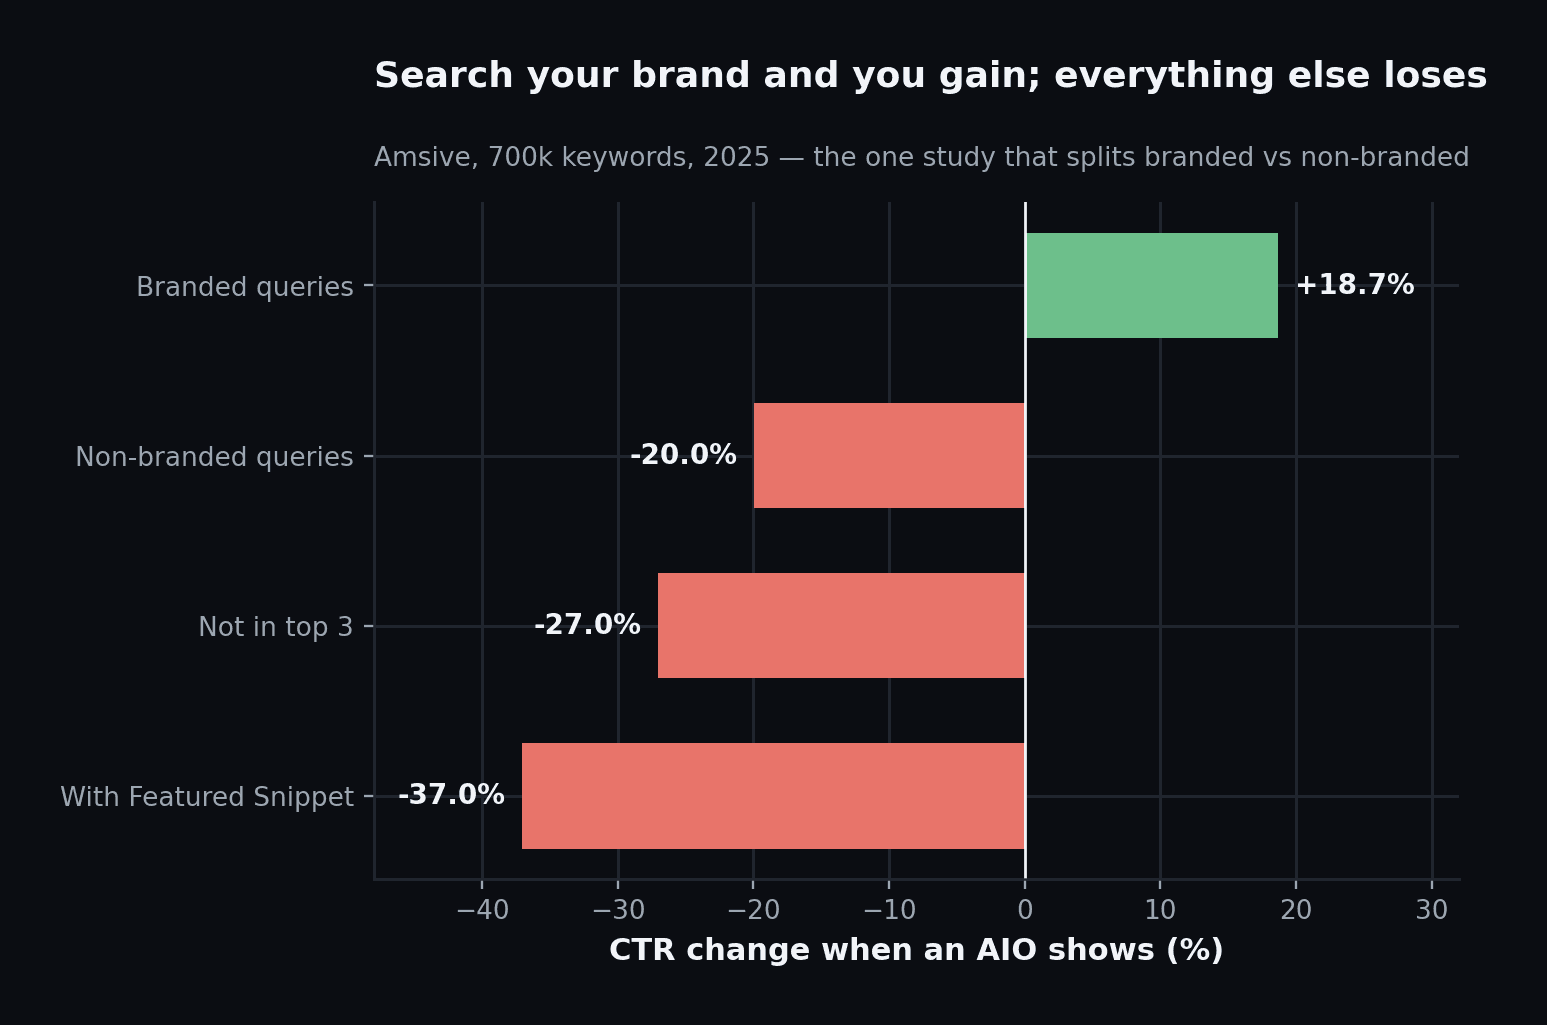
Figure 7: Branded search gains clicks when an AI Overview appears. Every non-branded cut loses.
Brand search is safe, even helped. When someone searches your brand, an AIO shows up less than 5% of the time, and when it does your CTR goes up.
Non-branded is where the damage lives. This is the top-of-funnel discovery search content marketing was built to win, and it's the part being eaten.
The losses stack. A non-branded term that also has a Featured Snippet loses 37%. The SERP features pile up.
What this means for youYour exposure comes down to how much of your traffic is branded. Strong brand demand shields you. Living on non-branded informational rankings means taking the full hit. So brand-building is now one of your best defences against AI Overviews. |
Studies Behind This Module
Amsive: Google AI Overviews CTR study: branded vs non-branded (700k keywords) (Click here).
Note: this is the only study in the corpus that cleanly splits branded from non-branded, so we report it on its own rather than averaging it into a trend.
Module 6: Who Gets Hit Hardest
The pain isn't spread evenly. Whether an AI Overview even appears: and so whether you're exposed, depends mostly on what the searcher wants, then on your industry.
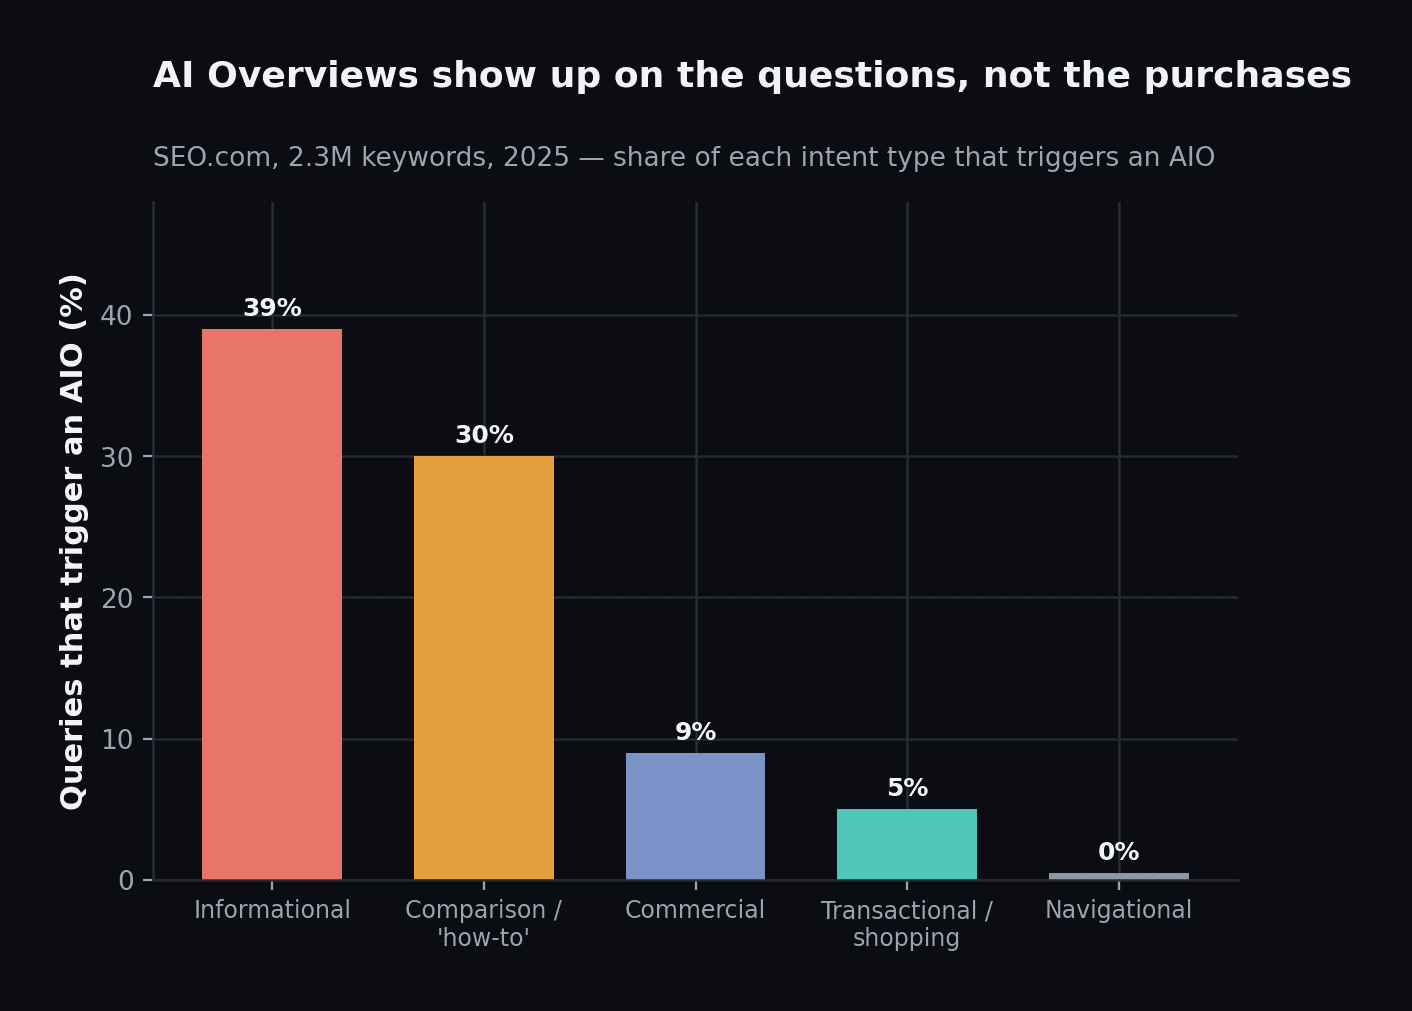
Figure 8: How often each type of query triggers an AI Overview. It's the questions that get answered on the page, not the purchases.
Informational and how-to searches are where AI Overviews concentrate. SEO.com found 39% of informational queries trigger one, and Semrush found about 80% of AI Overviews target informational intent. Shopping, transactional, local and navigational searches see them far less. So the industries that hurt most are the ones built on people asking questions.
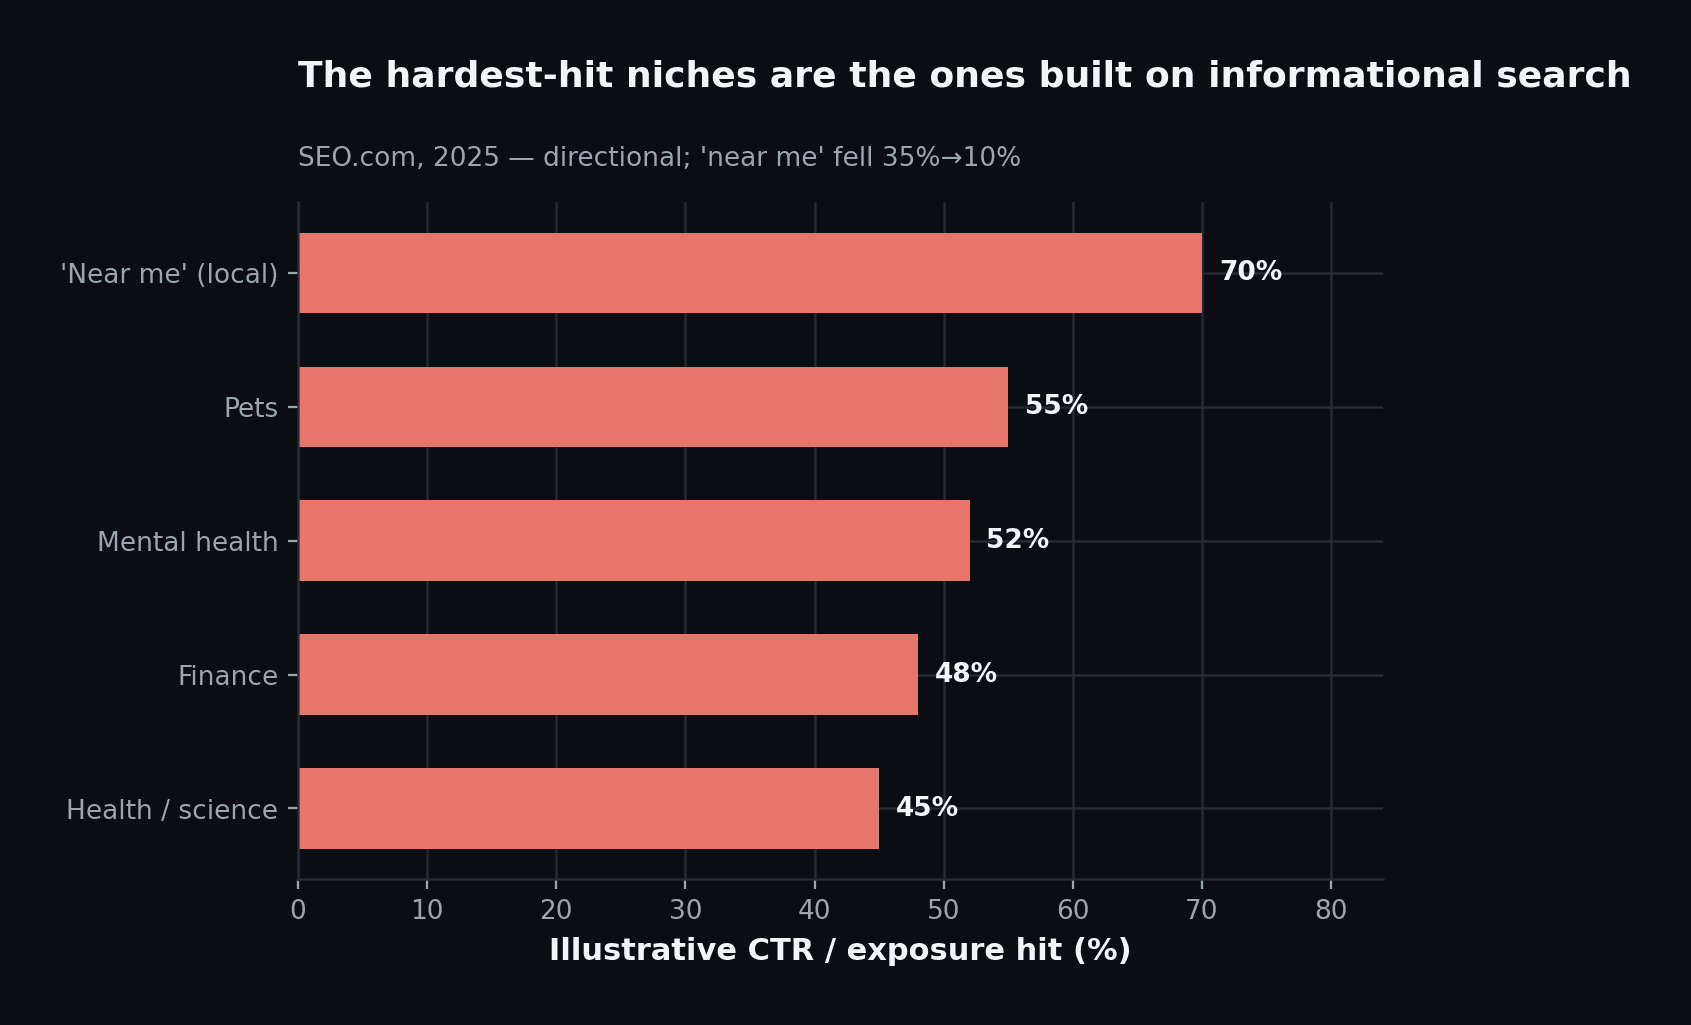
Figure 9: The niches taking the biggest hit: all of them built on informational search. 'Near me' queries fell from 35% to 10%.
What the searcher wants decides everything. Informational traffic is in the line of fire. Transactional and navigational traffic mostly isn't.
Pets, mental health, finance and health lead the losses. High-volume informational categories, exactly where Google is happiest answering directly.
Even some local search got hit. "Near me" queries dropped about 70%, so not everything transactional is safe.
What this means for youCheck your query mix before you panic or relax. Two companies with identical rankings can be in very different trouble depending on whether their traffic is informational or transactional. The blog content that fed your funnel is the exposed asset; product and purchase pages are far safer. |
Studies Behind This Module
SEO.com / WebFX: What 2.3 million keywords reveal about AI Overviews (Click here).
Semrush: AI Overviews intent & format study (Click here).
Authoritas: AI Overviews by user intent (Click here).
Module 7: The One Way to Come Out Ahead
If AI Overviews took the clicks, where did they go? The most useful finding in the corpus: the loss isn't shared evenly by everyone who ranks. It depends on whether you're named inside the answer.
Your situation | CTR vs a normal #1 result |
|---|---|
You rank, but you're left out of the AIO | clicks lost |
Normal #1 result, no AIO on the page | baseline |
Cited in the AIO: AISOS / SISTRIX (EU) | +22% |
Cited in the AIO: Seer (organic) | +35% |
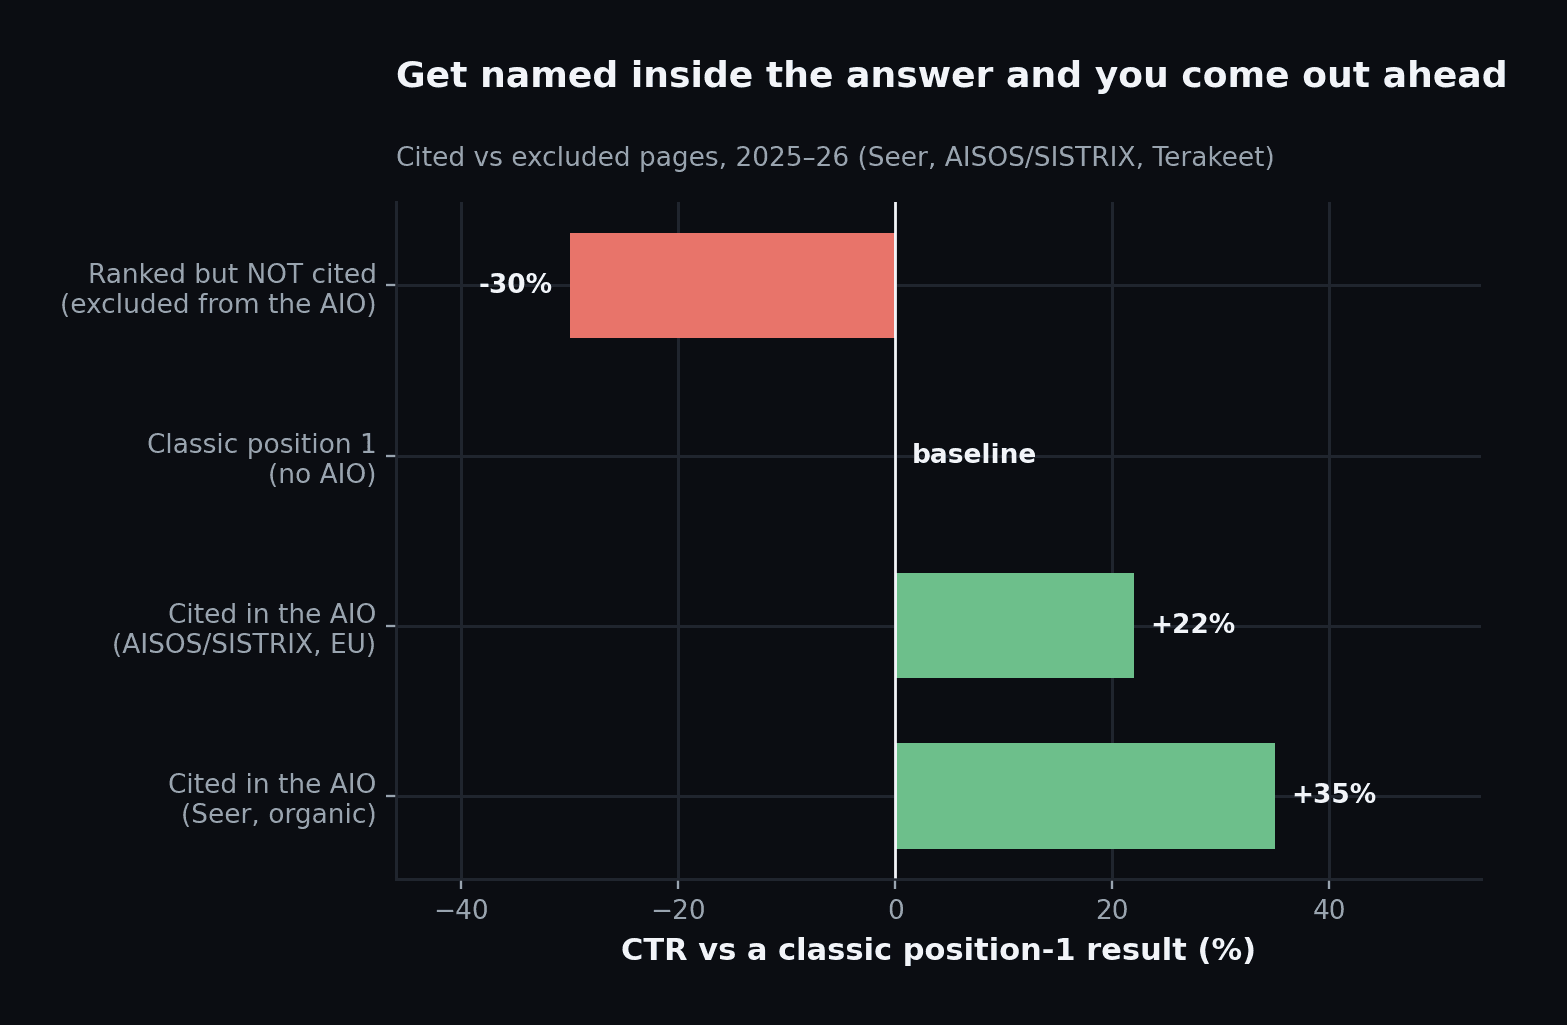
Figure 10: Citation is the switch. Get named inside the answer and you end up ahead of a normal #1; get left out and you lose.
Terakeet showed the same by measuring three situations: no AIO, cited in the AIO, and left out of it, and found citation, not raw ranking, was what mattered. seoClarity explains the mechanism: 97% of AI Overviews cite at least one page from the organic top 20, and the #1 page gets cited more than half the time. You can rank on page two and get cited, or rank first and get skipped.
Citation flips the outcome. Cited pages don't just lose less. They gain 22–35% over a normal #1, and up to 340% more impressions in the EU study.
Getting left out is the real penalty. The pages losing clicks are the ones that rank but don't make the answer.
Ranking and citation have split apart. AIOs pull from the whole top 20 and beyond, so citation is its own game, losable from #1, winnable from page two.
What this means for youThe goal has moved from "rank first" to "get cited." Pages named inside the AI Overview end up ahead of where they started. Writing for inclusion, clear, quotable, well-structured answers with real expertise behind them, is a separate skill from ranking, and it decides whether AI Overviews cost you traffic or hand you more. |
Studies Behind This Module
Terakeet: How AI Overviews impact traffic (cited vs excluded) (Click here).
Seer Interactive: AIO Impact on Google CTR (cited-page gains) (Click here).
AISOS / SISTRIX: Cited vs non-cited AIO CTR (EU) (Click here).
seoClarity: Impact of AI Overviews (citation overlap study) (Click here).
Recommendations
The findings are facts. What to do about them is our read.
Do this | Because (from the data) | Priority |
|---|---|---|
Write to get cited, not just to rank | Cited pages gain 22–35% over a normal #1 (M7) | High |
Build branded demand | Branded search gains +18.7% and rarely triggers an AIO (M5) | High |
Check your query mix by intent | Informational content is the exposed asset (M6) | High |
Split your GSC data by AIO presence | Impressions up while clicks fall is the tell-tale sign (M2–M3) | Medium |
Stop treating #1 as the whole game | A #1 spot loses ~58% on AIO queries (M1) | Medium |
Plan for a plateau, not a cliff | 2026 is flattening, not collapsing (M3) | Medium |
If you have strong branded demand
You're already shielded. Keep compounding brand search; it doubles as AI Overview insurance.
Shift some effort off defending informational rankings and onto earning citations for the informational queries you still want.
If you're a publisher or run on content
This is the exposed seat. Chase citations, quotable structure, clear answers, visible expertise, ahead of raw rank.
Spread your bets. The click economy has split across zero-click, AI engines, and normal search. Track all three, not just Google referrals.
Conclusion
It's real and it's big. Fifteen studies using five methods land on a 40–60% click loss when an AI Overview shows, with the cleanest #1 reading at 58%. That isn't up for debate.
It got steeper, then settled. The damage piled up in 2025 and shows early signs of flattening in 2026. Our read, and it is a read, is a new, lower normal rather than a slide with no bottom, though other countries are a year behind and still climbing.
The pain is targeted, and there's a way through. Branded, transactional and cited pages are fine or better off. Non-branded, informational, left-out pages carry the loss. That it's concentrated rather than universal is the most useful thing here: it tells you where to defend.
The bottom line: AI Overviews have taken about half the clicks from the queries they touch, the worst of the acceleration is probably behind us, and the winners are the brands and pages named inside the answer rather than just ranked beneath it.
Appendix: The Full Corpus
All 39 studies, oldest first. "Drop" is the normalised figure where a study reports a comparable click loss; the others carry their key metric instead. Full sources and coding live in the companion spreadsheet.
# | Yr | Source | What it measured | Drop / key metric | Type |
|---|---|---|---|---|---|
1 | 2024 | SparkToro + Datos | Zero-click rate (level) | 58.5% US / 59.7% EU zero-click; 360 US / 374 EU clicks per 1,000 to op | Original |
2 | 2024 | Search Engine Land (early forecast) | Prediction | Projected 18–64% organic click decline | Prediction |
3 | 2024 | Gartner | Prediction | Traditional search volume predicted to drop 25% by 2026 | Prediction |
4 | 2024 | Authoritas (+ Rich Sanger) | AIO prevalence / volatility | SGE ecommerce & branded/product impact; AIO volatility (~70% of cited | Original |
5 | 2024 | Authoritas (Dave Cousin) | AIO prevalence | AIO appearance by intent; 'cost' queries 88% trigger; navigational 0%; | Original |
6 | 2024 | Advanced Web Ranking (AWR) | AIO prevalence | AIO on 18.55% of results (Q3 2024), rising over time | Original |
7 | 2024 | BrightEdge | AIO prevalence | AIO in ~11–12.7% of queries mid-2024 | Original |
8 | 2024 | Siege Media | Agency client CTR (aggregate) | NEUTRAL: avg CTR up, impressions +4%, total traffic up in first 2 week | Original |
9 | 2024 | SE Ranking | AIO prevalence | AIO in 18.76% of US SERPs (Nov 2024); avg AIO text ~5,337 chars; long- | Original |
10 | 2024 | Semrush | AIO prevalence / intent | 80% of desktop & 76% of mobile AIOs targeted informational keywords; h | Original |
11 | 2024 | TollBit | AI-engine click rate | AI chatbots drive 95-96% less referral traffic than Google search; AI- | Original |
12 | 2025 | Seer Interactive | Query-level CTR (organic) | 54.6% | Original |
13 | 2025 | Ahrefs | Position-1 CTR | 34.5% | Original |
14 | 2025 | Amsive | Keyword-level CTR | 15.49% | Original |
15 | 2025 | Pew Research Center | Behavioral click rate | 46.7% | Original |
16 | 2025 | Seer Interactive | Query-level CTR (organic) | 61% | Original |
17 | 2025 | BrightEdge | Aggregate clicks vs impressions | 30% | Original |
18 | 2025 | Authoritas | Publisher CTR | 47.5% | Original |
19 | 2025 | Semrush | AIO prevalence | AIO prevalence 6.49% (Jan) → ~24.6% peak (Jul) → 15.69% (Nov); Datos z | Original |
20 | 2025 | Similarweb | Zero-click rate (level) | News-related zero-click 56% → ~69% | Original |
21 | 2025 | Kevin Indig + Search Engine Land | Behavioral click rate | 50% | Original |
22 | 2025 | DMG Media / MailOnline | Publisher CTR | 56% | Original |
23 | 2025 | Bain & Company | Traffic decline (est.) | 20% | Original |
24 | 2025 | iPullRank / Ahrefs (May snapshot) | AIO prevalence | 56M AIOs analysed; AIO in 13.5% of searches; clicks -34.5% when presen | Original |
25 | 2025 | seoClarity | AIO citation / prevalence | 97% of AIOs cite ≥1 source from top-20 organic; avg 5 URLs per AIO; P | Original |
26 | 2025 | seoClarity | Position-level CTR | 49.4% | Original |
27 | 2025 | SEO.com / WebFX | AIO prevalence | 39% of informational queries trigger AIO; 'near me' -70% (35%->10%); p | Original |
28 | 2025 | Terakeet | Query-level CTR (cited vs excluded) | CTR measured in 3 scenarios: no AIO / cited in AIO / excluded from AIO | Original |
29 | 2025 | Clarity Global | Aggregate clicks vs CTR | 32% | Original |
30 | 2026 | Ahrefs | Position-1 CTR | 58% | Original |
31 | 2026 | Seer Interactive | Query-level CTR (organic) | 61% | Original |
32 | 2026 | BrightEdge | AIO prevalence | AIO presence 31% → 48% (+58% YoY); avg AIO pixel height > full desktop | Original |
33 | 2026 | SparkToro + Similarweb | Zero-click rate (level) | <33% of searches send a click; US zero-click ~65%+ (up ~7.5pp since 20 | Original |
34 | 2026 | Define Media Group | Publisher clicks (aggregate) | 42% | Original |
35 | 2026 | SISTRIX | Position-1 CTR | 59.3% | Original |
36 | 2026 | Conductor | AIO prevalence | AIO on 25.11% of 21.9M analysed searches | Original |
37 | 2026 | Xponent21 | AIO prevalence | US AIO prevalence measured at 60.32% (AdvancedWebRanking-derived keywo | Original |
38 | 2026 | Slate | Position-level CTR benchmark | Position-level CTR by intent; -64% CTR cliff between pos #4 and #5 (co | Original |
39 | 2026 | AISOS / SISTRIX | Cited vs non-cited CTR | Cited sites +22% CTR vs classic position 1; +340% impressions for cite | Original |
Organic Labs Research, July 2026. The numbers are empirical and repeatable; the interpretation is ours.