We Asked 4 LLMs the Same Question 12,000 Times: Here’s What We Learned

Usman Akram
Study Parameters
Parameter | Cross-Prompt Management |
|---|---|
Prompts | "What are the best email marketing software tools?" / "What are the best video editing software tools?" / "What is the best project management software tool?" |
Models Tested | OpenAI (ChatGPT), Google Gemini, Anthropic Claude, Perplexity |
Runs Per Model Per Prompt | 1,000 |
Total Runs | 12,000 |
Tools Per Response | 10 (ranked list) |
Total Data Points | 120,000 individual tool recommendations |
Search Volume Source | Ahrefs (US market, monthly) |
Analytical Modules | 6 (Jaccard Similarity, Brand Rank Volatility, Unique List Count, Position Volatility, Cross-Model Agreement, Search Volume Correlation) |
Executive Summary
This report analyses how consistently four major LLMs, OpenAI (ChatGPT), Google Gemini, Anthropic Claude, and Perplexity, recommend software tools when asked the same query repeatedly.
The goal was simple: understand how deterministic these models actually are, and what that means for brands trying to optimise their visibility inside AI-generated results.
We set out to answer a few core questions:
How stable is each model across repeated runs?
How much overlap exists between outputs?
How much do rankings fluctuate from one run to another?
To what extent do models agree or disagree with each other?
Do AI-generated rankings correlate with real-world brand demand?
To generate statistically meaningful insights, we tested three commercial prompts:
What are the best email marketing software tools?
What are the best video editing software tools?
What are the best project management software tools?
Each prompt was run 1,000 times across all four models.
This resulted in 12,000 total responses, each containing ranked recommendation lists, which were then analysed using metrics like Jaccard similarity, rank volatility, cross-model agreement, and correlation with brand search demand.
The findings provide a clearer view into how consistent, or inconsistent, LLM outputs really are, and what that means for Generative Engine Optimization (AEO) strategies.
Model | Email marketing | Video Editing | Project MGMT | Cross-Prompt MGMT |
|---|---|---|---|---|
Open AI | 0.871 | 0.665 | 0.676 | 0.737 |
Gemini | 0.577 | 0.556 | 0.727 | 0.620 |
Claude | 0.682 | 0.771 | 0.918 | 0.790 |
Perplexity | 0.692 | 0.546 | 0.649 | 0.629 |
Key Takeaways at a Glance
Dimension | Finding |
|---|---|
Most Stable LLM | Claude (Jaccard 0.918 in PM): stability increases with category maturity across all three prompts |
Most Volatile LLM | Gemini: lowest or near-lowest Jaccard in 2 of 3 prompts; 99.6% unique ordered lists in email |
Most Deterministic LLM | Claude (PM): only 41 unique ordered lists from 4 unique brand sets; top list appeared 211 times (21.1% of runs) |
Universal #1 Brand | Asana: only brand with 100% frequency across all 4 models in any category (PM) |
Biggest Brand Perception Gap | Jira: 100% on Perplexity, 99.6% on Gemini, 94.8% on OpenAI, but 0% on Claude across all 1,000 PM runs |
SV ↔ Rank Correlation | Category-dependent: no correlation in email on any model; significant across all 4 models in PM only |
Most Similar Models | OpenAI × Gemini (Jaccard 0.660) in PM: highest cross-model agreement in the entire study |
Most Divergent Pair | Perplexity consistently in the bottom two pairs across every prompt and every category |
How to Read This Report
Each of the 6 modules below presents data from all three software categories side by side, followed by a unified cross-prompt insight.
Module | What It Answers |
|---|---|
Jaccard Similarity | How consistently does each model recommend the same set of tools across 1,000 runs? |
Brand Rank Volatility | Which brands are locked into specific positions, and which bounce unpredictably? |
Unique List Count | How deterministic is each model - how many genuinely different responses did it produce? |
Position Volatility | How many different brands ever occupied each rank slot (1–10) across all runs? |
Cross-Model Agreement | How similar are the four LLMs to each other, and which pairs diverge most? |
Search Volume Correlation | Does brand search popularity predict better LLM ranking in each category? |
Methodology
This study measured output consistency under controlled conditions.
Each prompt was run 1,000 times per model using identical inputs, with no variation in wording or context. Responses were parsed into ranked lists of 10 tools, preserving position for analysis.
Brand names were standardised to remove spelling and naming inconsistencies (e.g. legacy names or variations).
The cleaned datasets were then analysed to track:
Stability across repeated runs
Ranking changes over time
Overlap between results
Agreement across models
Analysis was done at both the list level (which tools appear) and ranking level (where they appear).
Prompts Analysed
What are the best email marketing software tools?
What are the best video editing software tools?
What are the best project management software tools?
Each prompt was analysed independently before comparing patterns across categories.
MODULE 1 - List Stability (Jaccard Similarity)
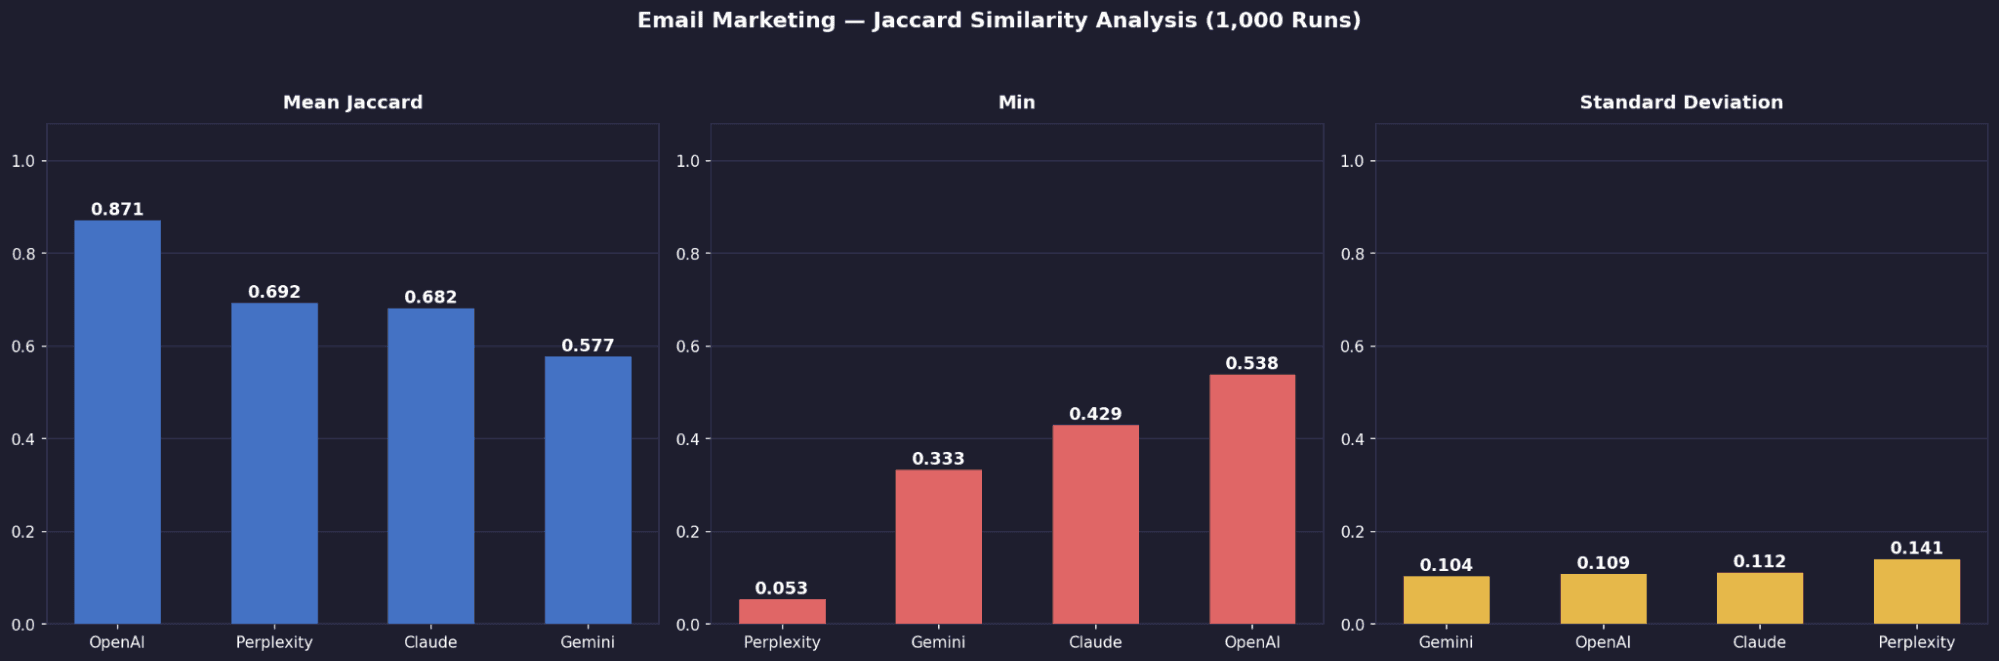
Jaccard similarity measures how consistent each model’s recommendations are across runs. A score of 1.0 means identical lists every time. Lower scores indicate more variation in which tools appear. We computed this across ~499,500 pairwise comparisons per model.
Metric | Prompt | Open AI | Gemini | Claude | Perplexity |
|---|---|---|---|---|---|
Mean Jaccard | Email Marketing | 0.871 | 0.577 | 0.682 | 0.692 |
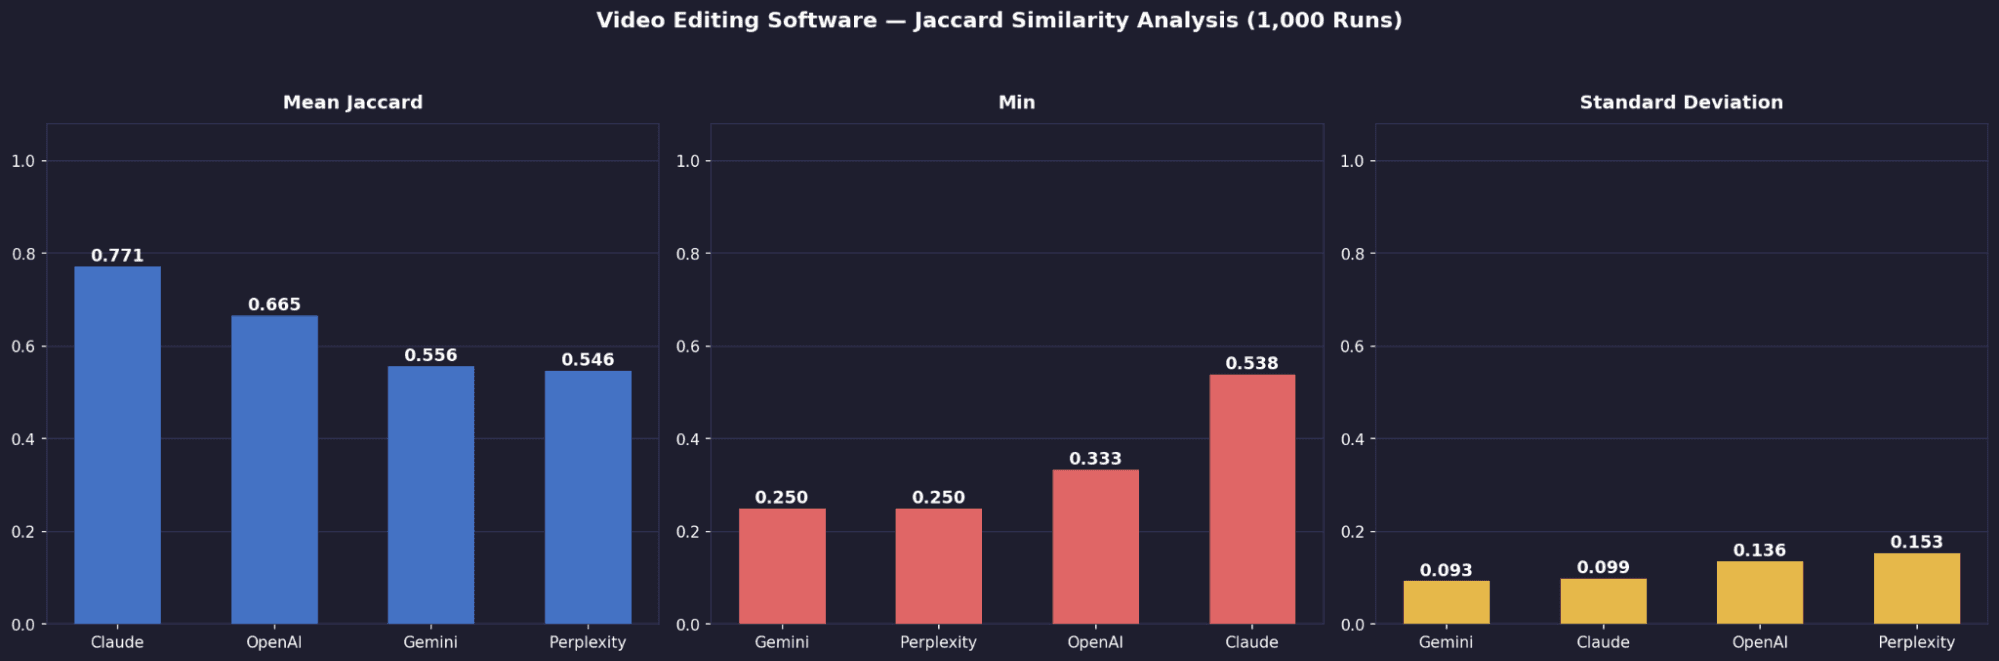
Mean Jaccard | Video Editing | 0.665 | 0.556 | 0.771 | 0.546 |
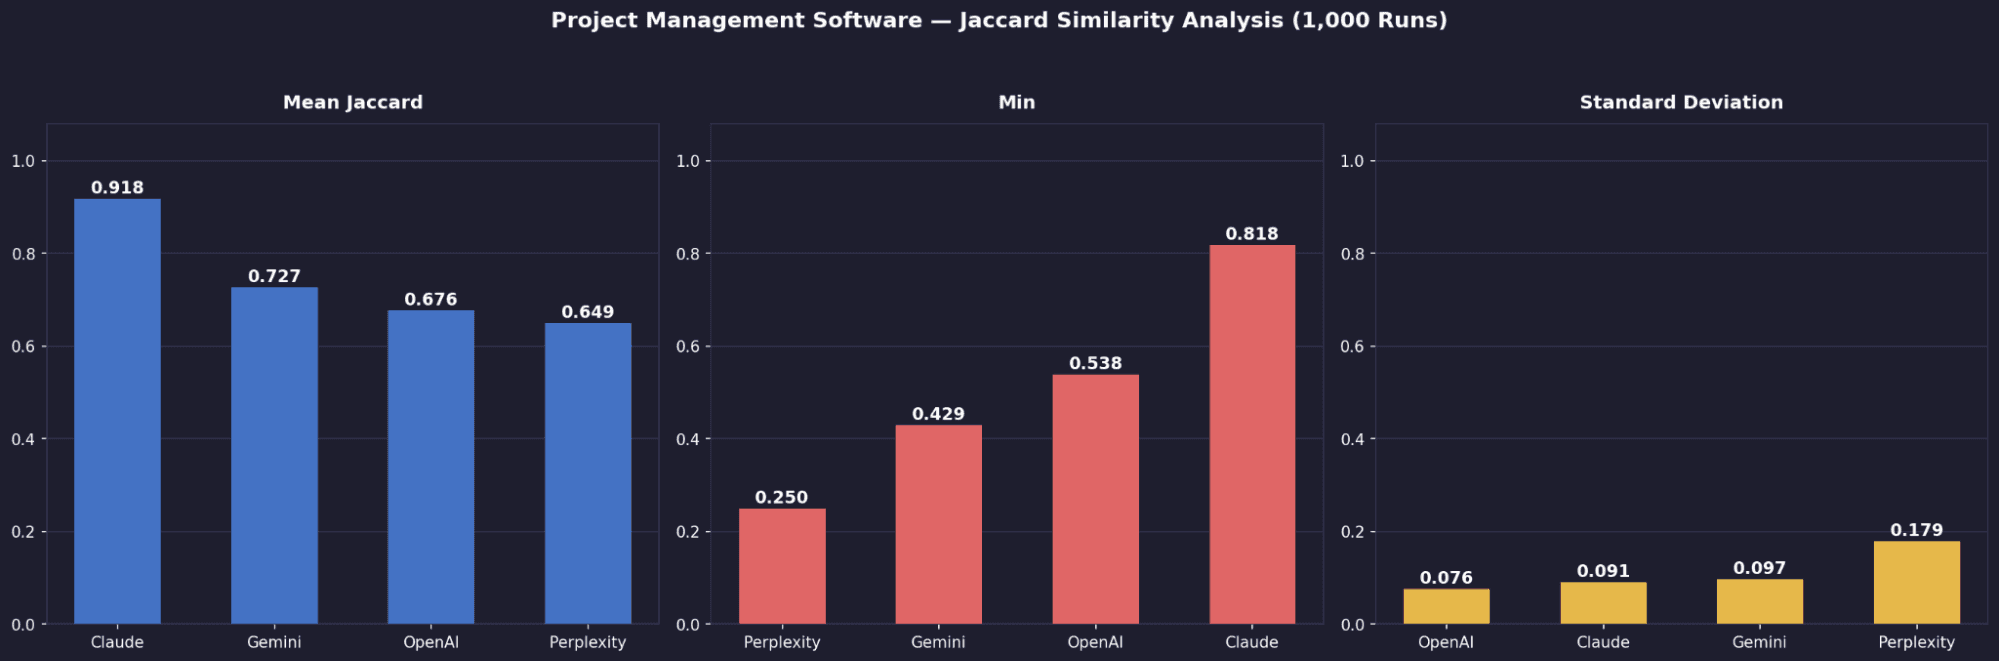
Mean Jaccard | Project Management | 0.676 | 0.727 | 0.918 | 0.649 |
Standard Deviation | Email Marketing | 0.109 | 0.104 | 0.112 | 0.141 |
Standard Deviation | Video Editing | 0.109 | 0.093 | 0.099 | 0.153 |
Standard Deviation | Project Management | 0.076 | 0.097 | 0.091 | 0.179 |
Worst-Case Min | Email Marketing | 0.538 | 0.333 | 0.429 | 0.053 |
Worst-Case Min | Video Editing | 0.333 | 0.250 | 0.538 | 0.250 |
Worst-Case Min | Project Management | 0.538 | 0.429 | 0.818 | 0.250 |
Email Marketing - Jaccard Distribution by Model
Video Editing - Jaccard Distribution by Model
Project Management - Jaccard Distribution by Model
Key Findings
OpenAI is the most stable, but only in email (0.871)
It leads overall, driven by strong consistency in email marketing. Outside of that, its stability drops closer to the rest.Claude’s stability is category-dependent, not intrinsic
It improves from 0.682 (email) → 0.771 (video) → 0.918 (project management). The more established and well-documented the category, the more “crystallised” its outputs become.Gemini is weakest in email and video, but improves in mature categories
It lags in email (0.577) and video (0.556), but jumps to 0.727 in project management, suggesting it responds better when the category is more standardised.Perplexity is the most volatile model overall
Despite a decent mean (0.692), it has the highest standard deviation (up to 0.153) and the worst single outlier (min 0.053), meaning some runs are highly inconsistent.Worst-case reliability separates Claude from Perplexity
Claude maintains relatively strong minimum overlap (0.429–0.818 depending on category), while Perplexity drops as low as 0.053, making it far less predictable.
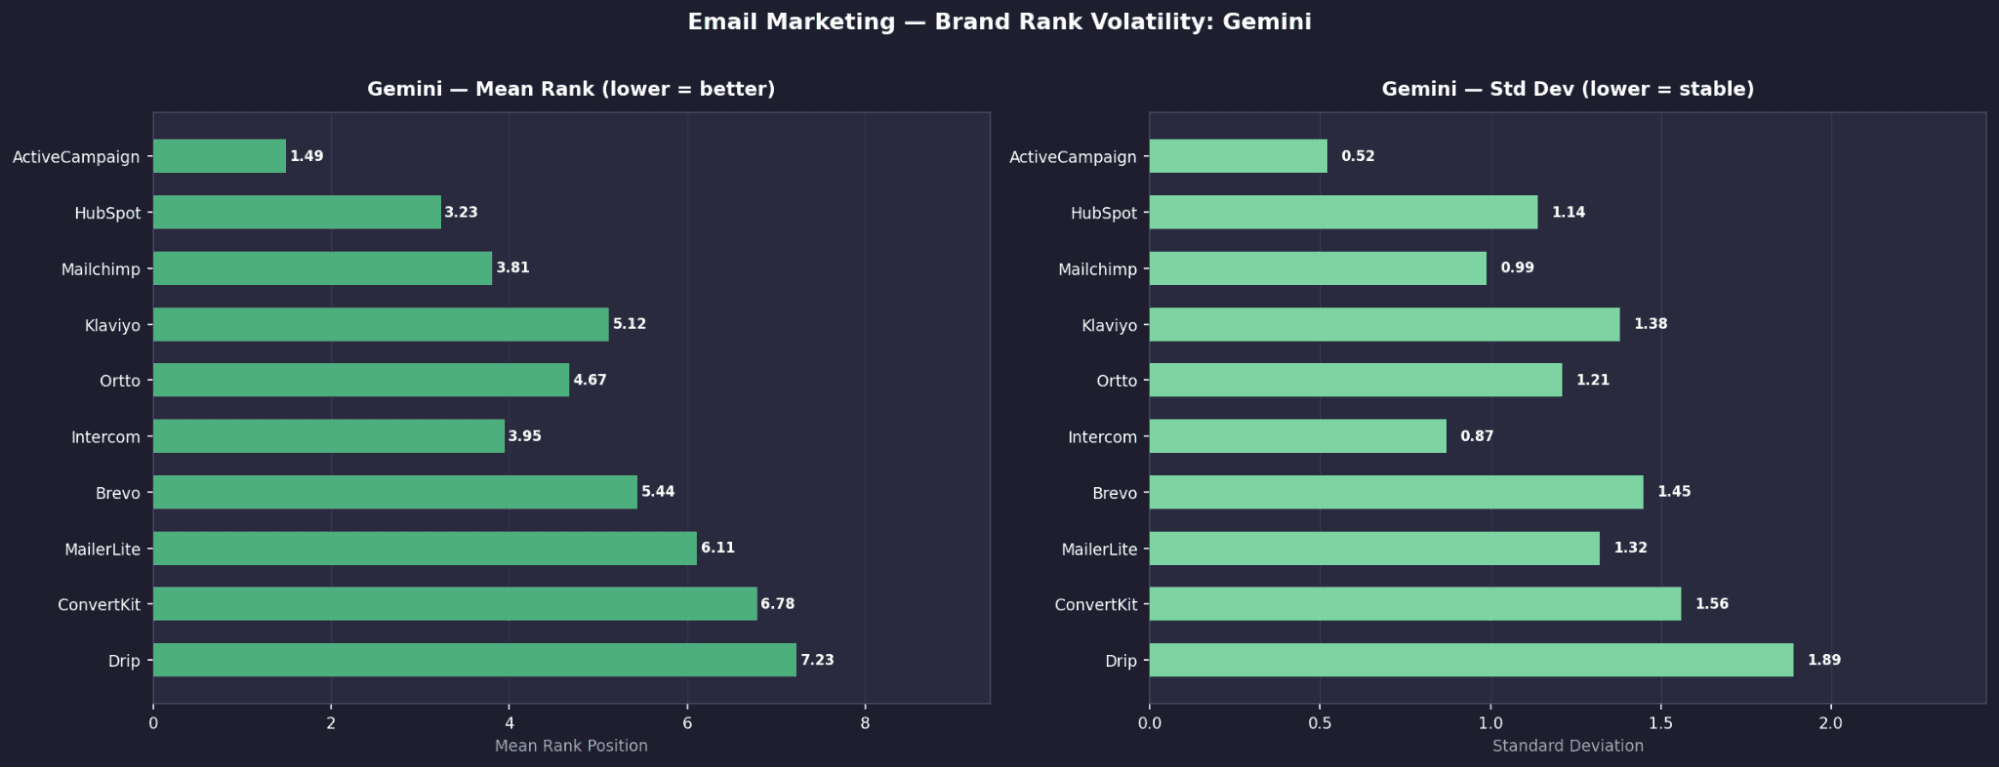
MODULE 2 - Brand Rank Volatility
This module looks at how stable each brand’s position is across runs.
For every brand, we calculated:
Mean Rank
Standard deviation (σ)
Minimum and maximum position
Appearance rate across 1,000 runs
A low σ means the brand holds a consistent position.
A high σ means its ranking shifts significantly between runs.
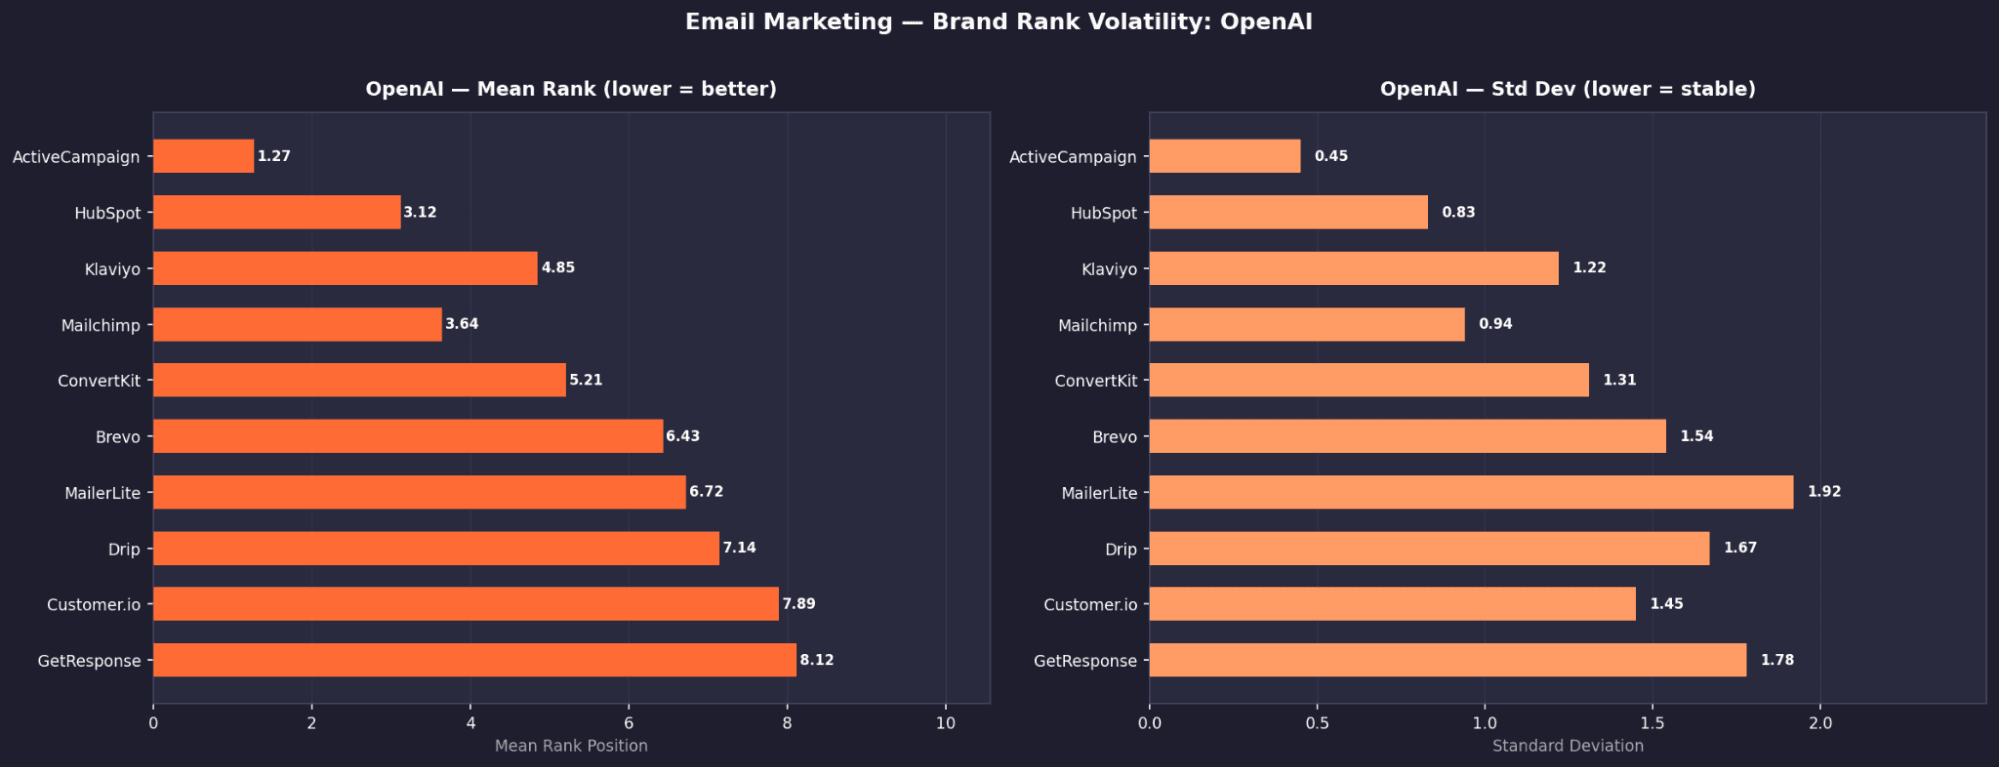
Email Marketing Software - Top Tools by Model: Mean Rank & Appearance Rate
OpenAI — Top 10 Tools
Rank | Tool | Mean Rank | σ | Appearance % | US Search Vol |
|---|---|---|---|---|---|
1 | Active Campaign | 1.27 | 0.45 | 100% | 18,000 |
2 | Customer.io | 1.93 | 0.32 | 100% | 1,800 |
3 | Hubspot | 3.11 | 0.77 | 99.6% | 411,000 |
4 | Mailchimp | 4.22 | 0.78 | 99.7% | 345,0002 |
5 | ConvertKit | 4.82 | 0.76 | 100% | 17,000 |
6 | Drip | 6.86 | 1.18 | 99.2% | 83,000 |
7 | Moosend | 7.79 | 0.78 | 98.6% | 3,700 |
8 | MailerLite | 8.48 | 1.92 | 88.6% | 52,000 |
9 | Brevo | 8.53 | 1.23 | 86.6% | 29,000 |
10 | Campaign Monitor | 8.42 | 1.36 | 25.9% | 7,100 |
Gemini — Top 10 Tools
Rank | Tool | Mean Rank | σ | Appearance % | US Search Vol |
|---|---|---|---|---|---|
1 | Active Campaign | 1.49 | 0.62 | 100% | 18,000 |
2 | Customer.io | 1.69 | 0.75 | 100% | 1,800 |
3 | Hubspot | 3.22 | 1.09 | 98.0% | 411,000 |
4 | Intercom | 4.46 | 1.50 | 96.2% | 30,000 |
5 | Ortto | 6.33 | 1.64 | 81.2% | 500 |
6 | Brevo | 5.33 | 1.59 | 80.3% | 29,000 |
7 | GetResponse | 7.72 | 1.39 | 70.8% | 7,500 |
8 | MailerLite | 8.30 | 1.17 | 69.3% | 52,000 |
9 | Drip | 6.66 | 1.70 | 67.6% | 83,000 |
10 | Mailchimp | 9.31 | 0.83 | 50.1% | 345,000 |
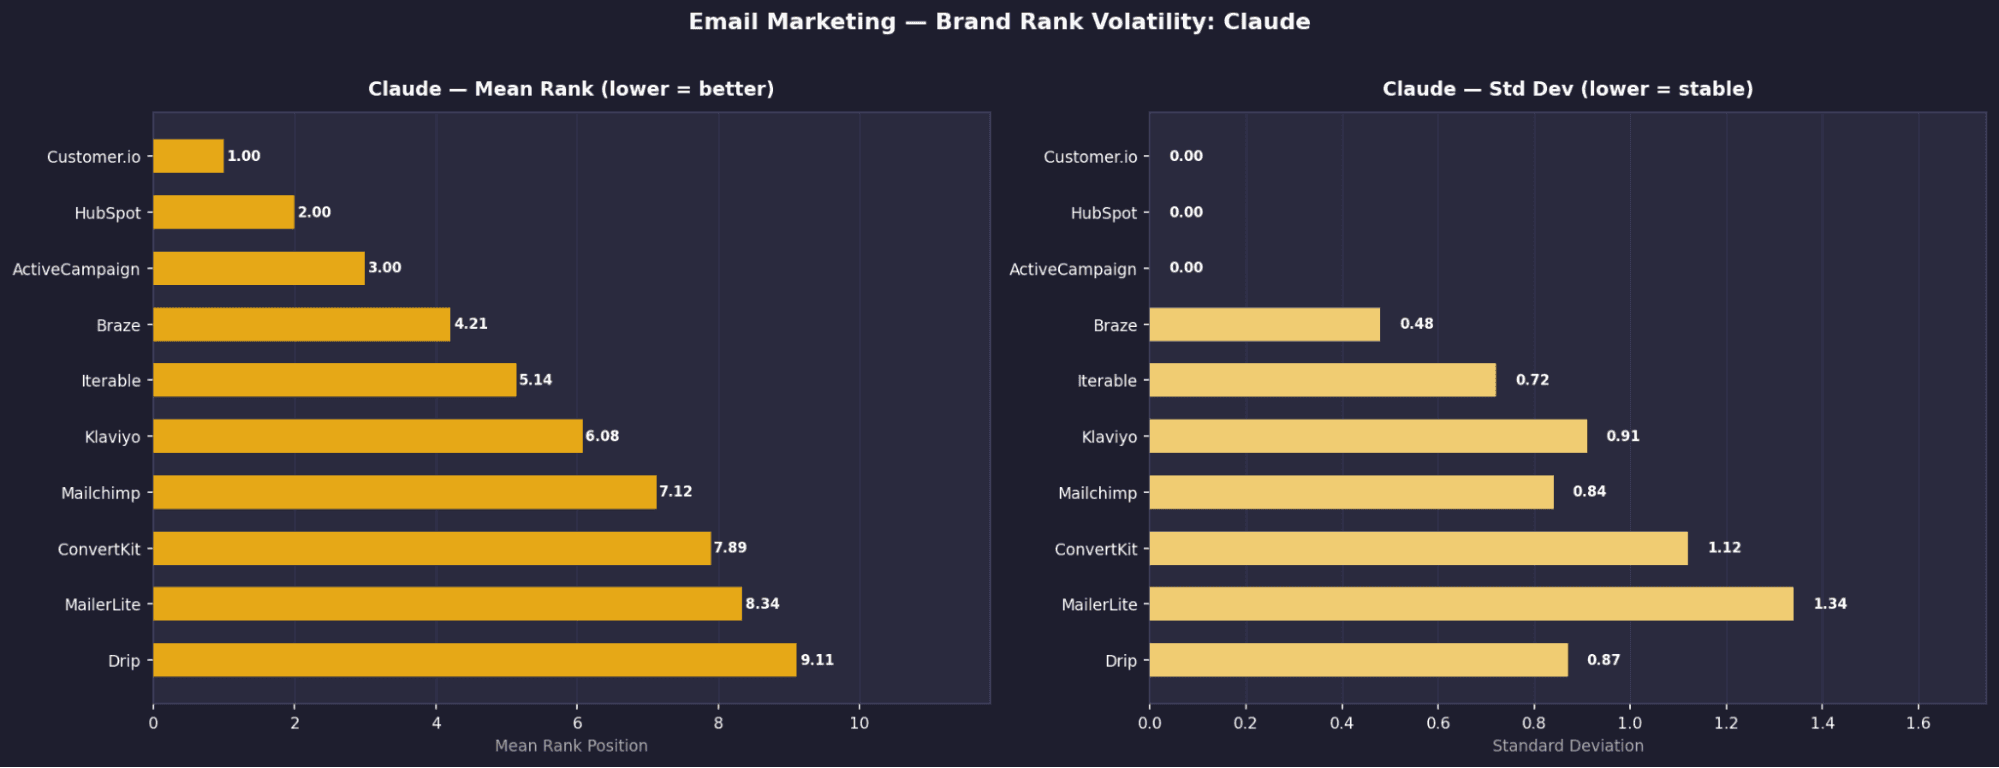
Claude — Top 10 Tools
Rank | Tool | Mean Rank | σ | Appearance % | US Search Vol |
|---|---|---|---|---|---|
1 | Customer.io | 1.00 | 0.00 | 100% | 1,800 |
2 | Hubspot | 2.00 | 0.00 | 100% | 411,000 |
3 | ActiveCampaign | 3.00 | 0.00 | 100% | 18,000 |
4 | Mailchimp | 6.61 | 0.98 | 100% | 345,000 |
5 | Klaviyo | 6.69 | 0.91 | 99.7% | 95,000 |
6 | Drip | 8.31 | 1.05 | 81.8% | 83,000 |
7 | Iterable | 6.01 | 0.87 | 75.3% | 8,700 |
8 | Braze | 4.64 | 0.78 | 74.4% | 24,000 |
9 | ConvertKit | 9.17 | 0.68 | 71.8% | 17,000 |
10 | Intercom | 4.29 | 0.62 | 56.8% | 30,000 |
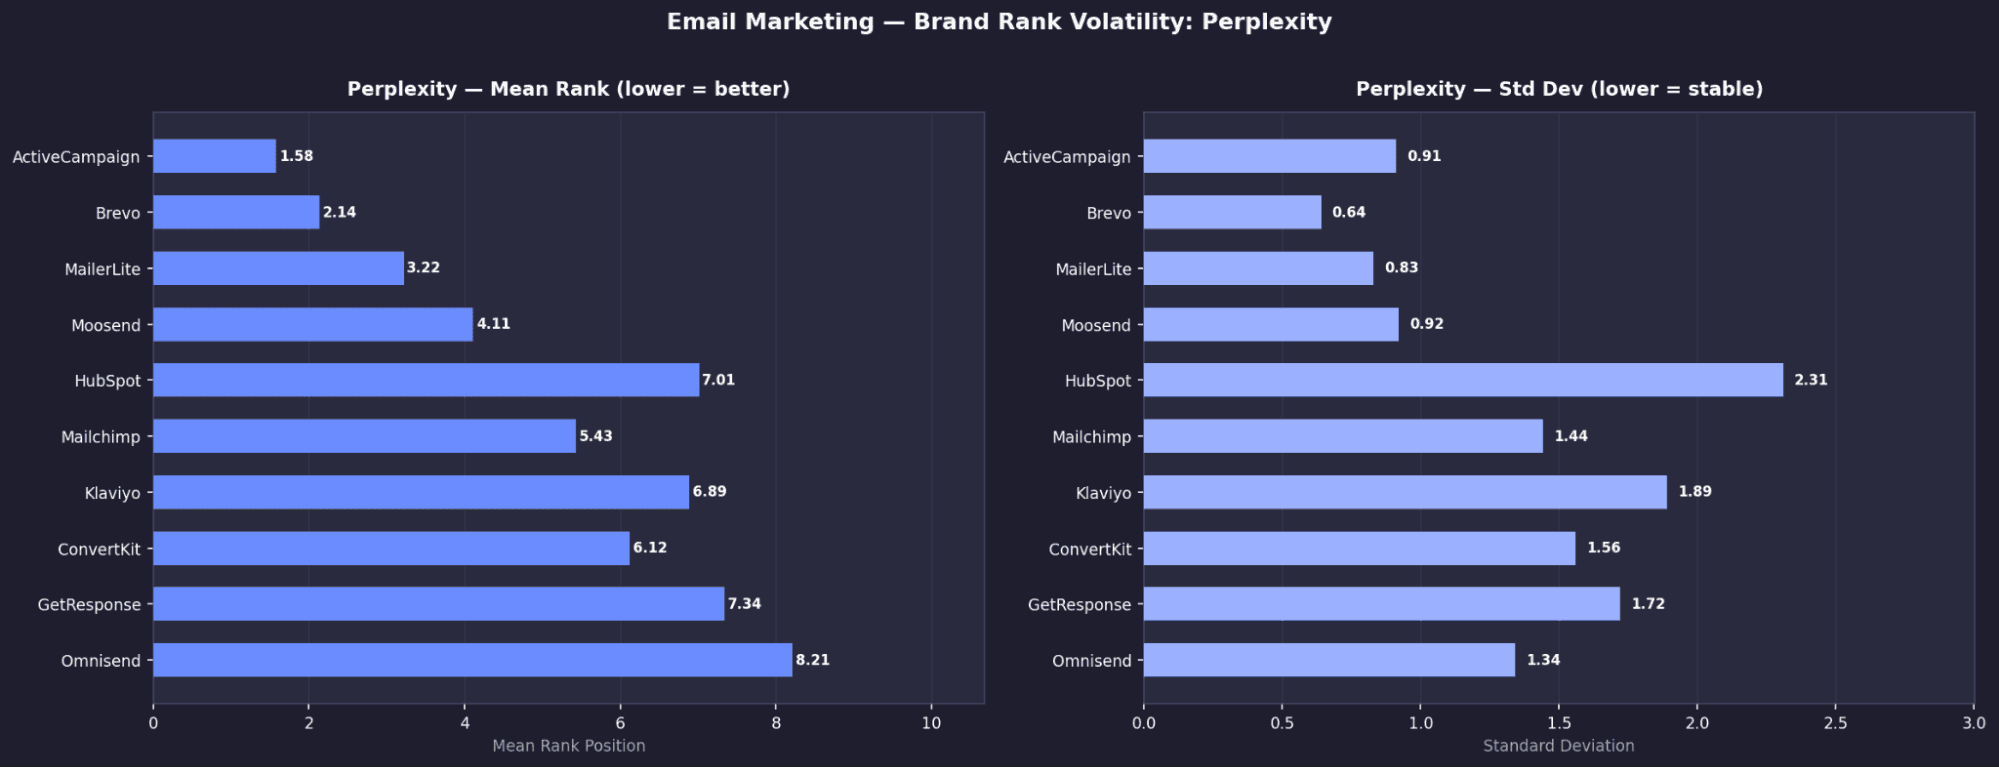
Perplexity — Top 10 Tools
Rank | Tool | Mean Rank | σ | Appearance % | US Search Vol |
|---|---|---|---|---|---|
1 | Active Campaign | 1.58 | 0.91 | 100% | 18,000 |
2 | Brevo | 1.89 | 0.93 | 99.9 | 29,000 |
3 | MailerLite | 2.93 | 1.13 | 99.6% | 52,000 |
4 | Moosend | 4.33 | 1.44 | 95.9% | 3,700 |
5 | Constant Contact | 8.13 | 1.37 | 92.2% | 225,000 |
6 | GetResponse | 7.00 | 1.16 | 92.2% | 7,500 |
7 | AWeber | 7.29 | 0.79 | 90.1% | 6,600 |
8 | Klaviyo | 7.12 | 1.89 | 61.1% | 95,000 |
9 | Mailchimp | 5.85 | 1.87 | 56.4% | 345,000 |
10 | HubSpot | 7.01 | 2.31 | 53.8% | 411,000 |
Email Marketing - Key Brand Signals
ActiveCampaign is the only universally dominant brand
It appears in 100% of runs across all models and ranks in the top 2 on three of them.Claude fully locks its top 3, zero variation
Customer.io (#1), HubSpot (#2), and ActiveCampaign (#3) all have σ = 0.00, meaning their positions never change.HubSpot shows extreme model divergence
It is fixed at #2 on Claude, but drops to 53.8% appearance and ~rank 7 on Perplexity, showing large disagreement across models.Perplexity promotes a different toolset entirely
Tools like Brevo (99.9%), MailerLite (99.6%), and Moosend (95.9%) are heavily favoured here but far less visible on other models.High visibility ≠ strong positioning
MailerLite appears frequently on OpenAI (88.6%) but has σ = 1.92, moving anywhere from rank 2 to 10.
Email Marketing - Brand Rank Volatility: Open AI
Email Marketing - Brand Rank Volatility: Gemini
Email Marketing - Brand Rank Volatility: Claude
Email Marketing - Brand Rank Volatility: Perplexity
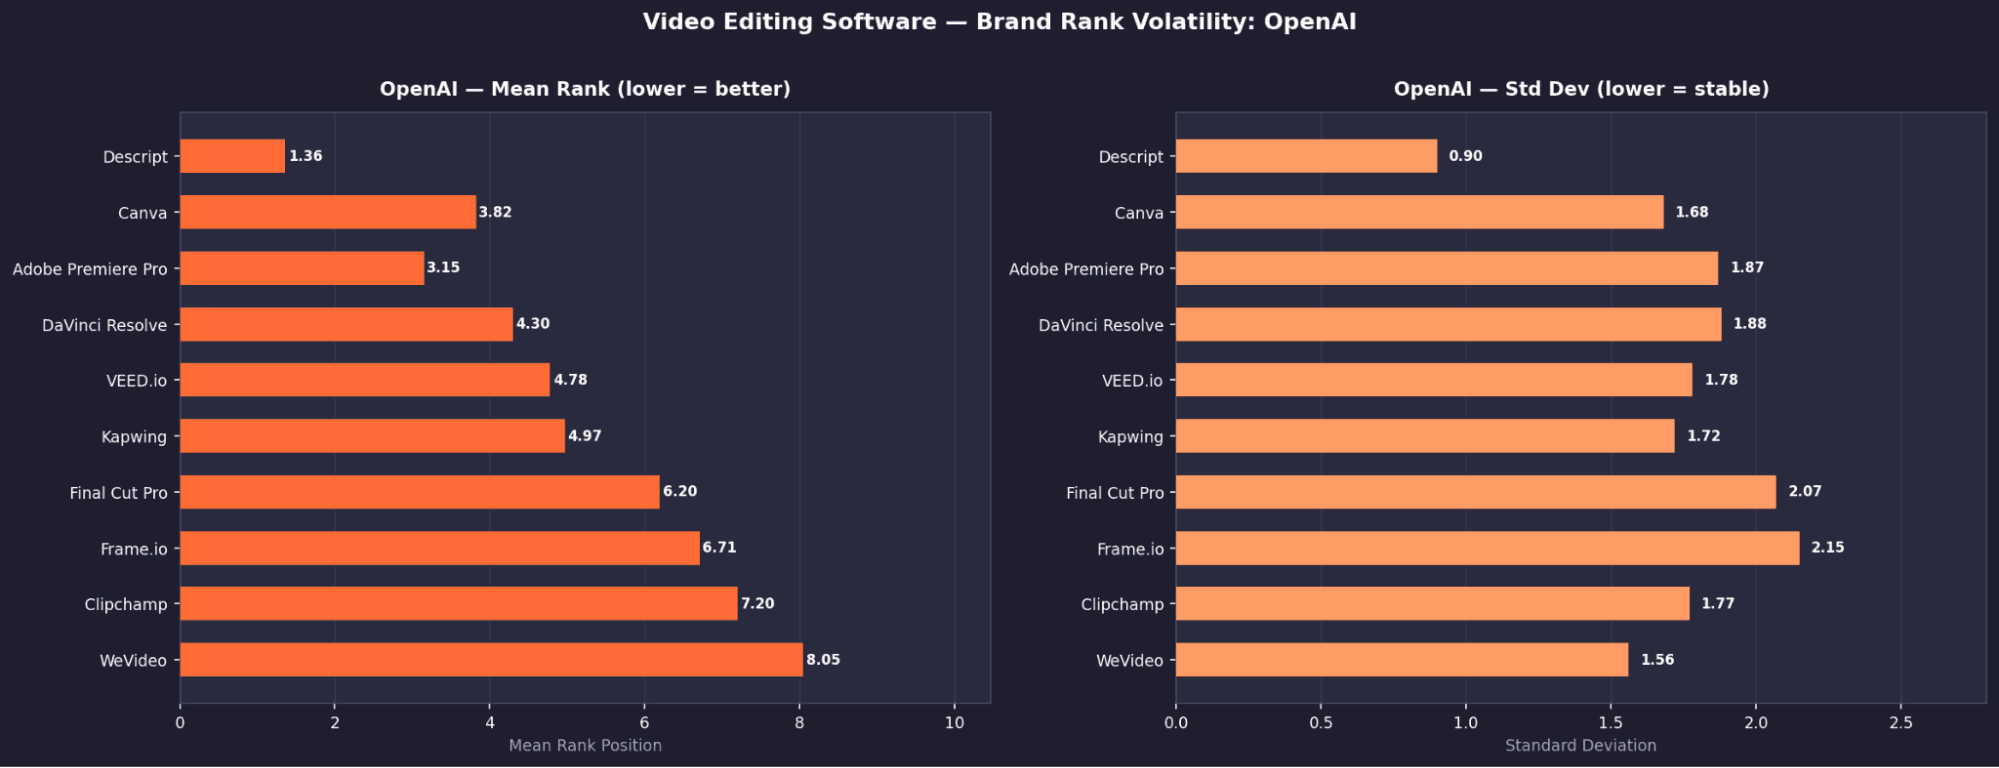
Video Editing - Top Tools by Model: Mean Rank & Appearance Rate
OpenAI — Top 10 Tools
Rank | Tool | Mean Rank | σ | Appearance % |
|---|---|---|---|---|
1 | Descript | 1.36 | 0.9 | ~95% |
2 | Canva | 3.82 | 1.68 | ~90% |
3 | Adobe Premiere Pro | 3.15 | 1.87 | ~88% |
4 | DaVinci Resolve | 4.3 | 1.88 | ~85% |
5 | VEED.io | 4.78 | 1.78 | ~80% |
6 | Kapwing | 4.97 | 1.72 | ~78% |
7 | Final Cut Pro | 6.2 | 2.07 | ~75% |
8 | Frame.io | 6.71 | 2.15 | ~70% |
9 | Clipchamp | 7.2 | 1.77 | ~65% |
10 | WeVideo | 8.05 | 1.56 | ~60% |
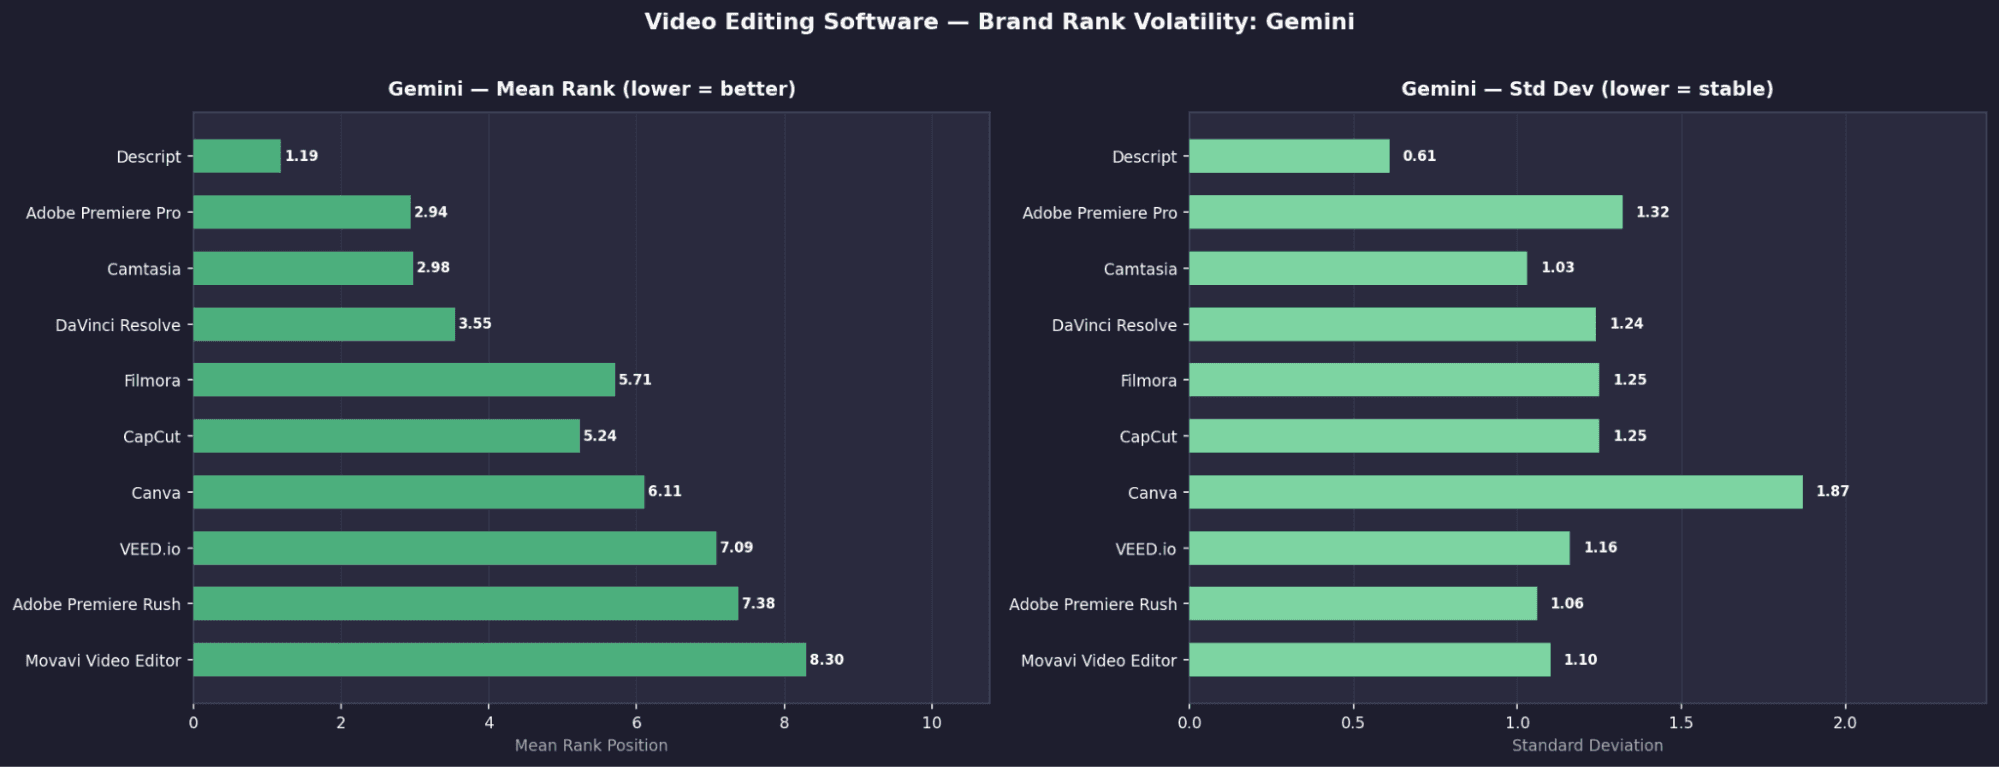
Gemini — Top 10 Tools
Rank | Tool | Mean Rank | σ | Appearance % |
|---|---|---|---|---|
1 | Descript | 1.19 | 0.61 | ~94% |
2 | Adobe Premiere Pro | 2.94 | 1.32 | ~88% |
3 | Camtasia | 2.98 | 1.03 | ~86% |
4 | DaVinci Resolve | 3.55 | 1.24 | ~84% |
5 | Filmora | 5.71 | 1.25 | ~75% |
6 | CapCut | 5.24 | 1.25 | ~72% |
7 | Canva | 6.11 | 1.87 | ~68% |
8 | VEED.io | 7.09 | 1.16 | ~65% |
9 | Adobe Premiere Rush | 7.38 | 1.06 | ~60% |
10 | Movavi Video Editor | 8.3 | 2.1 | ~55% |
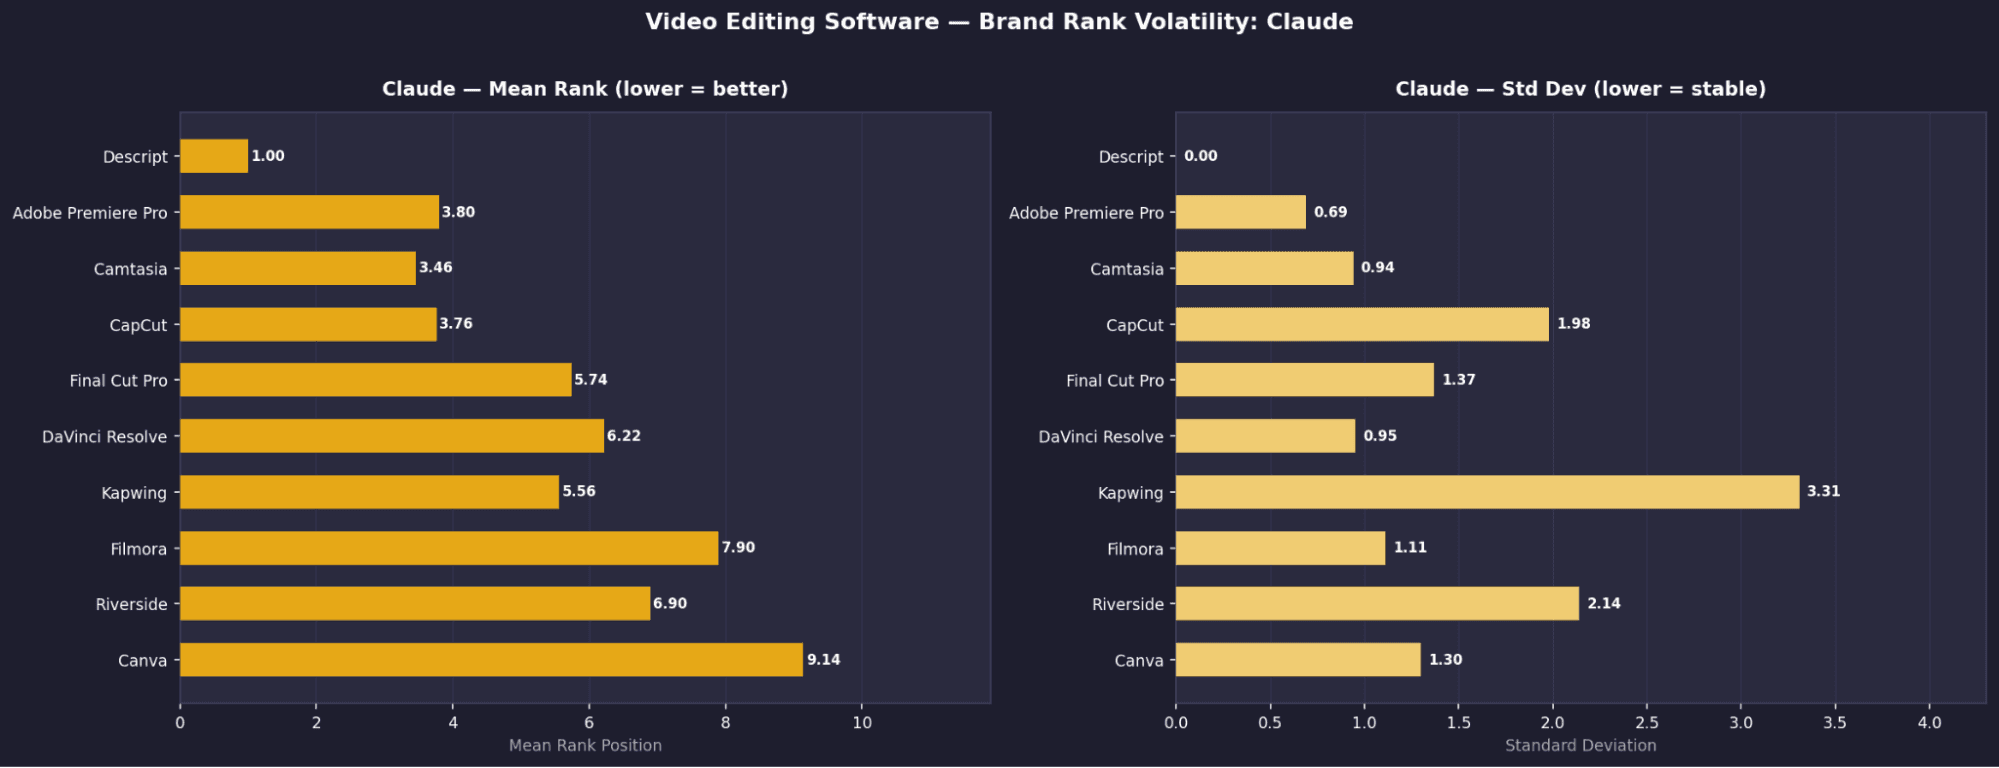
Claude — Top 10 Tools
Rank | Tool | Mean Rank | σ | Appearance % |
|---|---|---|---|---|
1 | Descript | 1 | 0 | 100% |
2 | Adobe Premiere Pro | 3.8 | 0.69 | ~92% |
3 | Camtasia | 3.46 | 0.94 | ~90% |
4 | CapCut | 3.78 | 1.98 | ~88% |
5 | Final Cut Pro | 5.74 | 1.37 | ~80% |
6 | DaVinci Resolve | 6.22 | 0.85 | ~78% |
7 | Kapwing | 5.5 | 3.31 | 86.10% |
8 | Filmora | 7.9 | 1.11 | ~70% |
9 | Riverside | 6.9 | 2.14 | ~65% |
10 | Canva | 8.14 | 1.3 | ~60% |
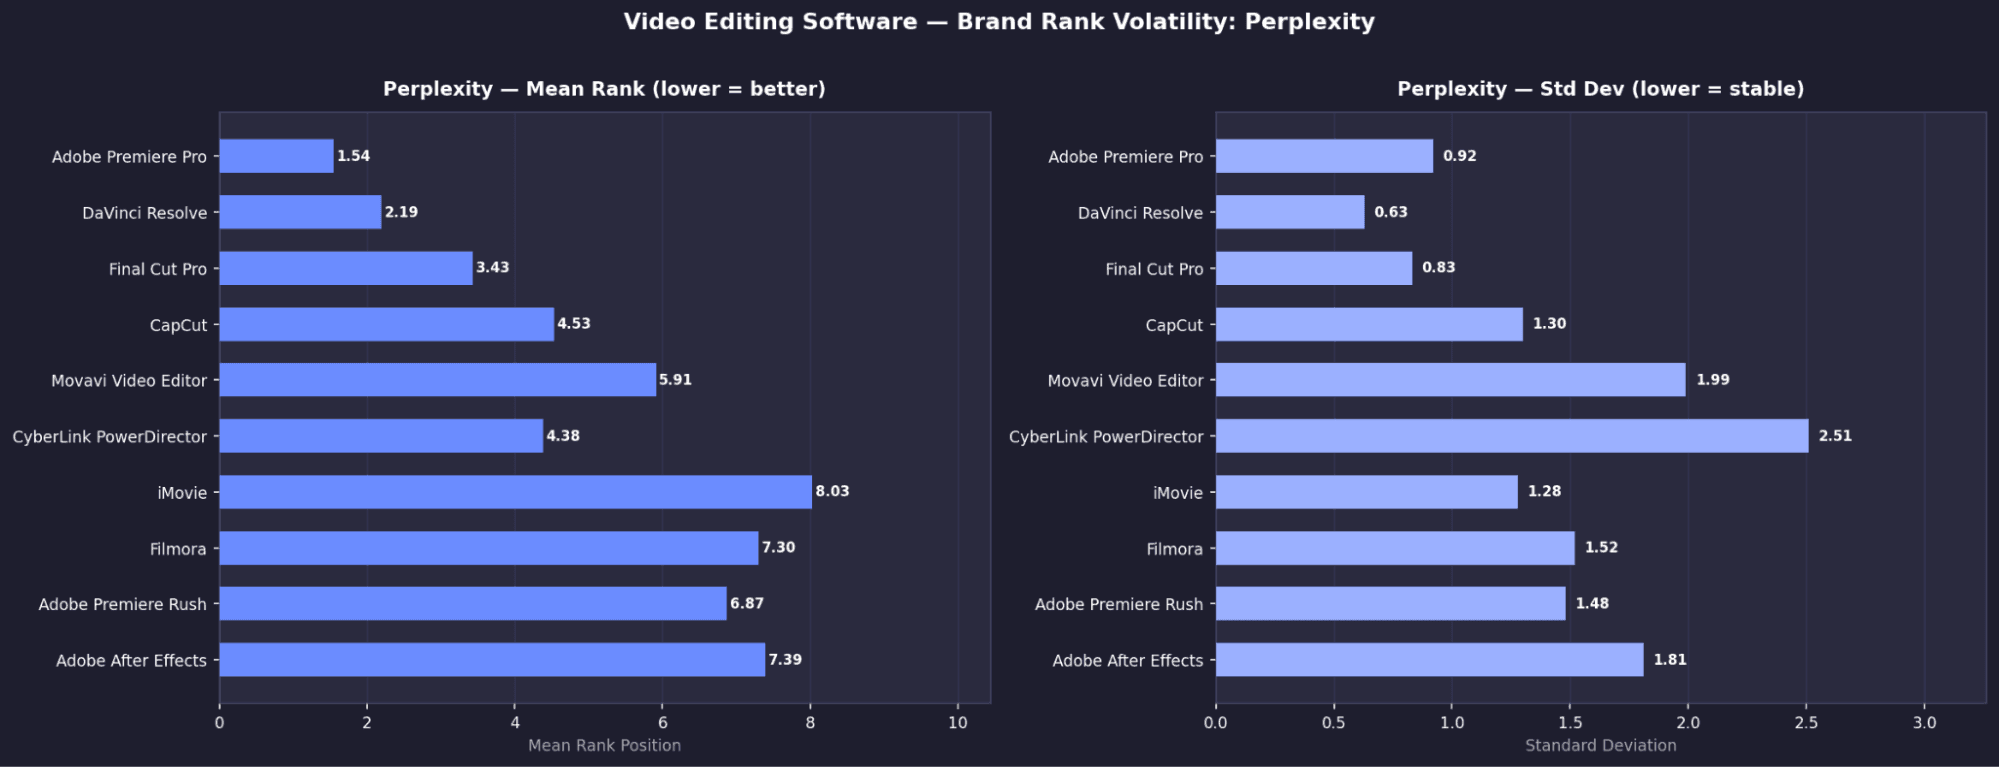
Perplexity — Top 10 Tools
Rank | Tool | Mean Rank | σ | Appearance % |
|---|---|---|---|---|
1 | Adobe Premiere Pro | 1.54 | 0.92 | ~95% |
2 | DaVinci Resolve | 2.19 | 0.63 | ~93% |
3 | Final Cut Pro | 3.43 | 0.83 | ~90% |
4 | CapCut | 4.53 | 1.3 | ~80% |
5 | Movavi Video Editor | 5.91 | 1.99 | ~72% |
6 | CyberLink PowerDirector | 6.38 | 2.51 | ~65% |
7 | iMovie | 8.03 | 1.28 | ~60% |
8 | Filmora | 7.3 | 1.52 | ~58% |
9 | Adobe Premiere Rush | 6.87 | 1.48 | ~55% |
10 | Adobe After Effects | 7.39 | 1.81 | ~50% |
Video Editing - Key Brand Signals
Descript dominates, but not universally
It ranks #1 on OpenAI (1.36), Gemini (1.19), and Claude (1.00), but appears only ~1.5% on Perplexity, showing sharp model disagreement.Claude again shows “rank locking” behavior
Descript holds rank #1 with σ = 0.00 across all runs, the only tool in this category with zero variation.Perplexity favours traditional desktop tools
Its top results are Adobe Premiere Pro, DaVinci Resolve, and Final Cut Pro, unlike other models which lean more toward newer or SaaS tools.No shared consensus across models
No two models agree on the same top 3, making video editing the most contested category in the study.Visibility without authority is common
Kapwing appears in 86% of Claude runs but has σ = 3.31, swinging widely in rank, high presence, low positional trust.
Video Editing - Brand Rank Volatility: Open AI
Video Editing - Brand Rank Volatility: Gemini
Video Editing - Brand Rank Volatility: Claude
Video Editing - Brand Rank Volatility: Perplexity
Project Management - Top Tools by Model: Mean Rank & Appearance Rate
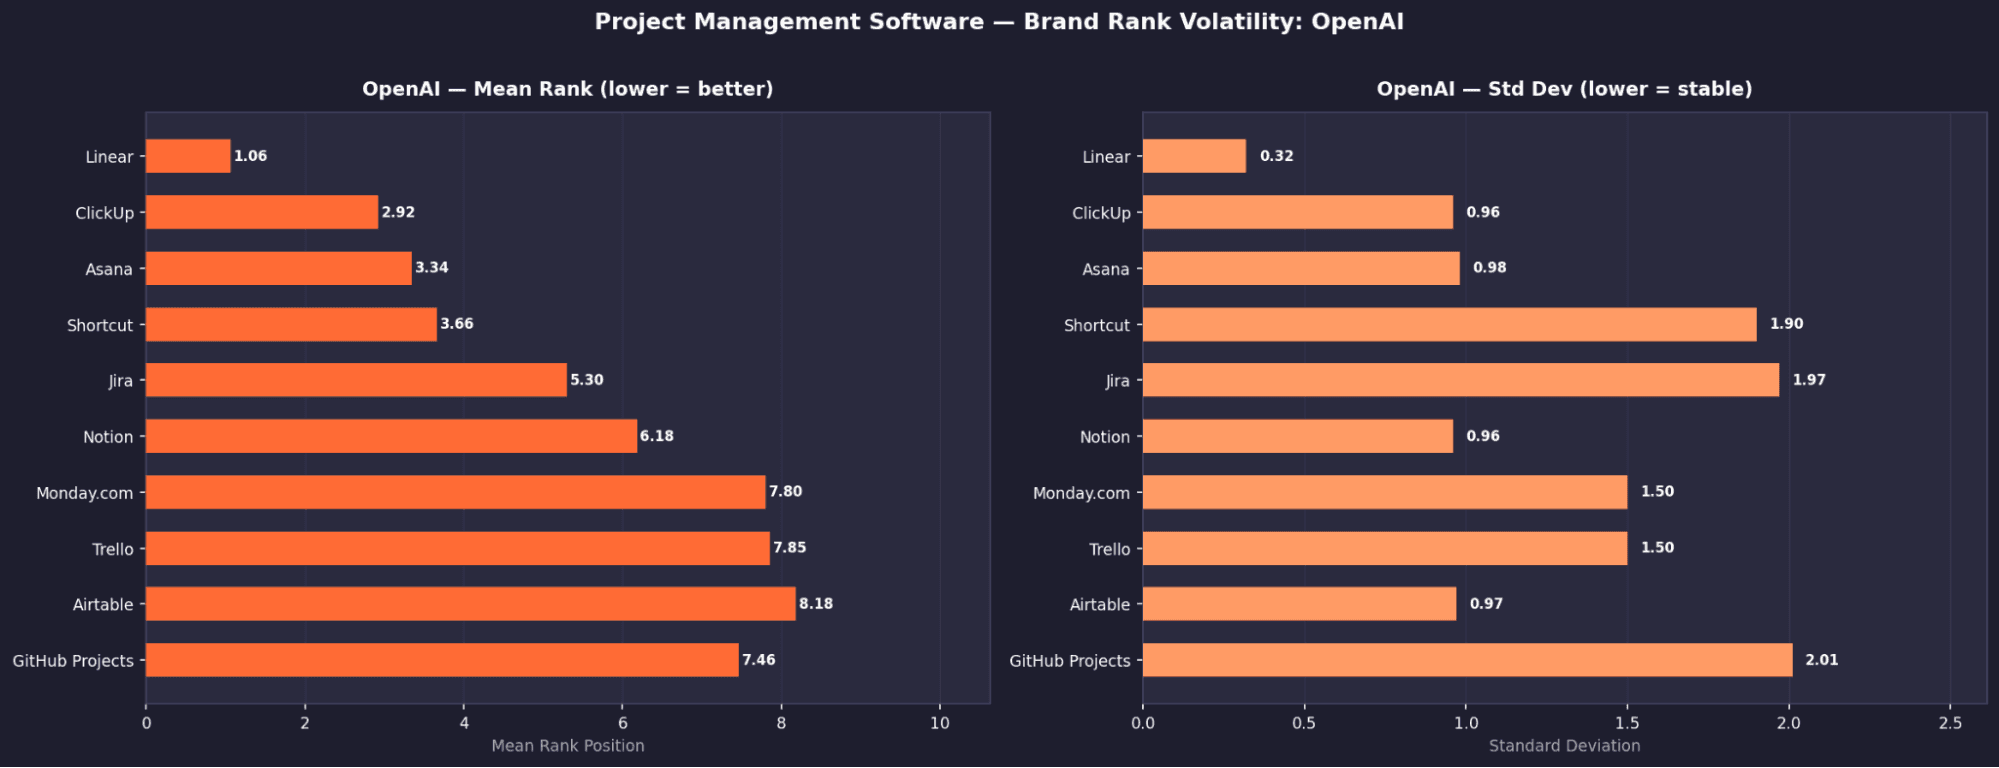
OpenAI — Top 10 Tools
Rank | Tool | Mean Rank | σ | Appearance % |
|---|---|---|---|---|
1 | Linear | 1.08 | 0.32 | ~98% |
2 | ClickUp | 2.92 | 0.96 | ~97% |
3 | Asana | 3.34 | 0.98 | 100% |
4 | Shortcut | 3.86 | 1.9 | ~85% |
5 | Jira | 5.3 | 1.97 | 94.80% |
6 | Notion | 6.18 | 0.96 | ~88% |
7 | Monday.com | 7.8 | 1.5 | ~82% |
8 | Trello | 7.85 | 1.5 | ~78% |
9 | Airtable | 8.18 | 0.97 | ~70% |
10 | GitHub Projects | 7.46 | 2.01 | ~65% |
Gemini — Top 10 Tools
Rank | Tool | Mean Rank | σ | Appearance % |
|---|---|---|---|---|
1 | Asana | 1.04 | 0.21 | 100% |
2 | ClickUp | 2.28 | 0.53 | ~99% |
3 | Monday.com | 3.17 | 0.82 | ~97% |
4 | Jira | 4.33 | 1.39 | 99.60% |
5 | Notion | 5.29 | 1.05 | ~90% |
6 | Linear | 5.28 | 1.09 | ~88% |
7 | Trello | 6.97 | 1.07 | ~82% |
8 | Wrike | 8.24 | 1.12 | ~75% |
9 | Airtable | 7.66 | 1.24 | ~70% |
10 | Teamwork | 7.94 | 1.3 | ~65% |
Claude — Top 10 Tools
Rank | Tool | Mean Rank | σ | Appearance % |
|---|---|---|---|---|
1 | Asana | 1 | 0 | 100% |
2 | Linear | 2.06 | 0.26 | ~99% |
3 | ClickUp | 2.94 | 0.24 | ~99% |
4 | Monday.com | 4.49 | 0.51 | ~95% |
5 | Notion | 4.51 | 0.5 | ~94% |
6 | Shortcut | 6 | 0 | 100% |
7 | Teamwork | 7.19 | 0.39 | ~88% |
8 | Height | 8.5 | 1.1 | ~75% |
9 | Basecamp | 9.29 | 0.88 | ~70% |
10 | Wrike | 8.89 | 0.54 | ~65% |
Perplexity — Top 10 Tools
Rank | Tool | Mean Rank | σ | Appearance % |
|---|---|---|---|---|
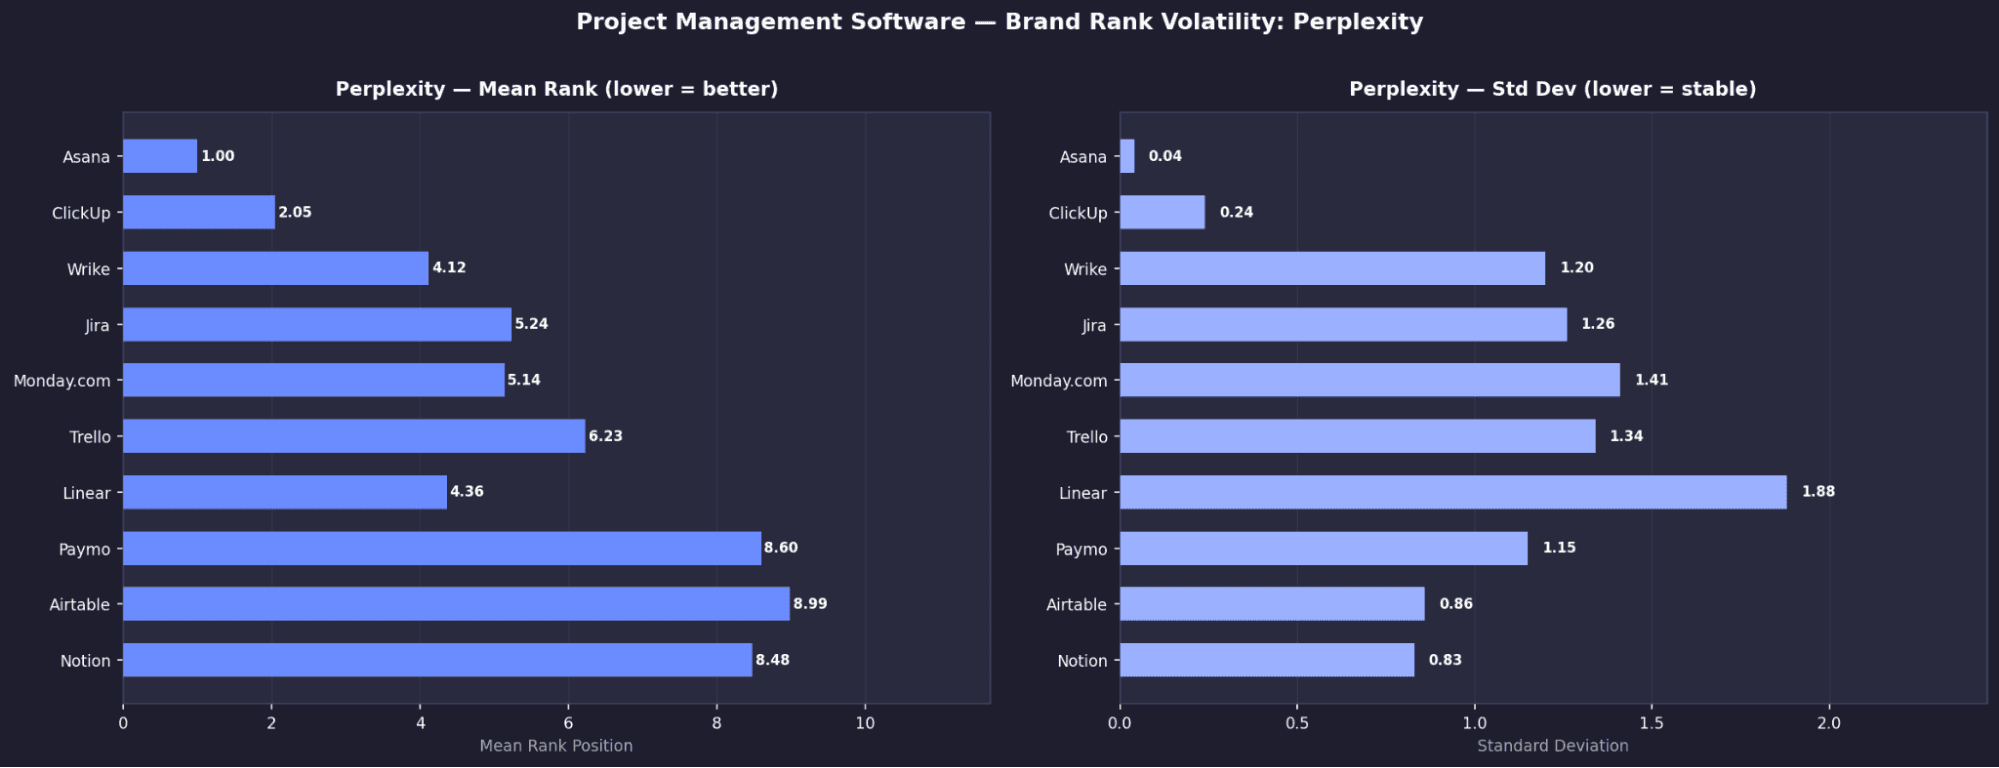
1 | Asana | 1 | 0.04 | 100% |
2 | ClickUp | 2.05 | 0.24 | ~99% |
3 | Wrike | 4.12 | 1.2 | 100% |
4 | Jira | 5.24 | 1.26 | 100% |
5 | Monday.com | 5.14 | 1.41 | ~95% |
6 | Trello | 6.23 | 1.34 | ~90% |
7 | Linear | 4.38 | 1.88 | ~80% |
8 | Paymo | 8.6 | 1.15 | 62% |
9 | Airtable | 8.99 | 0.86 | ~55% |
10 | Notion | 8.48 | 0.83 | ~50% |
Project Management- Key Brand Signals
Asana is the only truly universal brand in the entire study
It appears in 100% of runs across all four models, with consistently top rankings.Claude shows extreme rank determinism
Asana is locked at #1 and Shortcut at #6, both with σ = 0.00, meaning completely fixed positions.Jira disappears entirely on Claude
Despite near-universal presence on other models (100% Perplexity, 99.6% Gemini, 94.8% OpenAI), it has 0% appearance on Claude.Perplexity surfaces a different ecosystem
Tools like Paymo (62%), Scoro (25%), and Celoxis (20%) appear here but are largely invisible elsewhere.Wrike is heavily model-dependent
It ranks in Perplexity’s top 3 (100%, mean rank 4.12) but barely appears on other models.
Project Management - Brand Rank Volatility: Open AI
Project Management - Brand Rank Volatility: Gemini
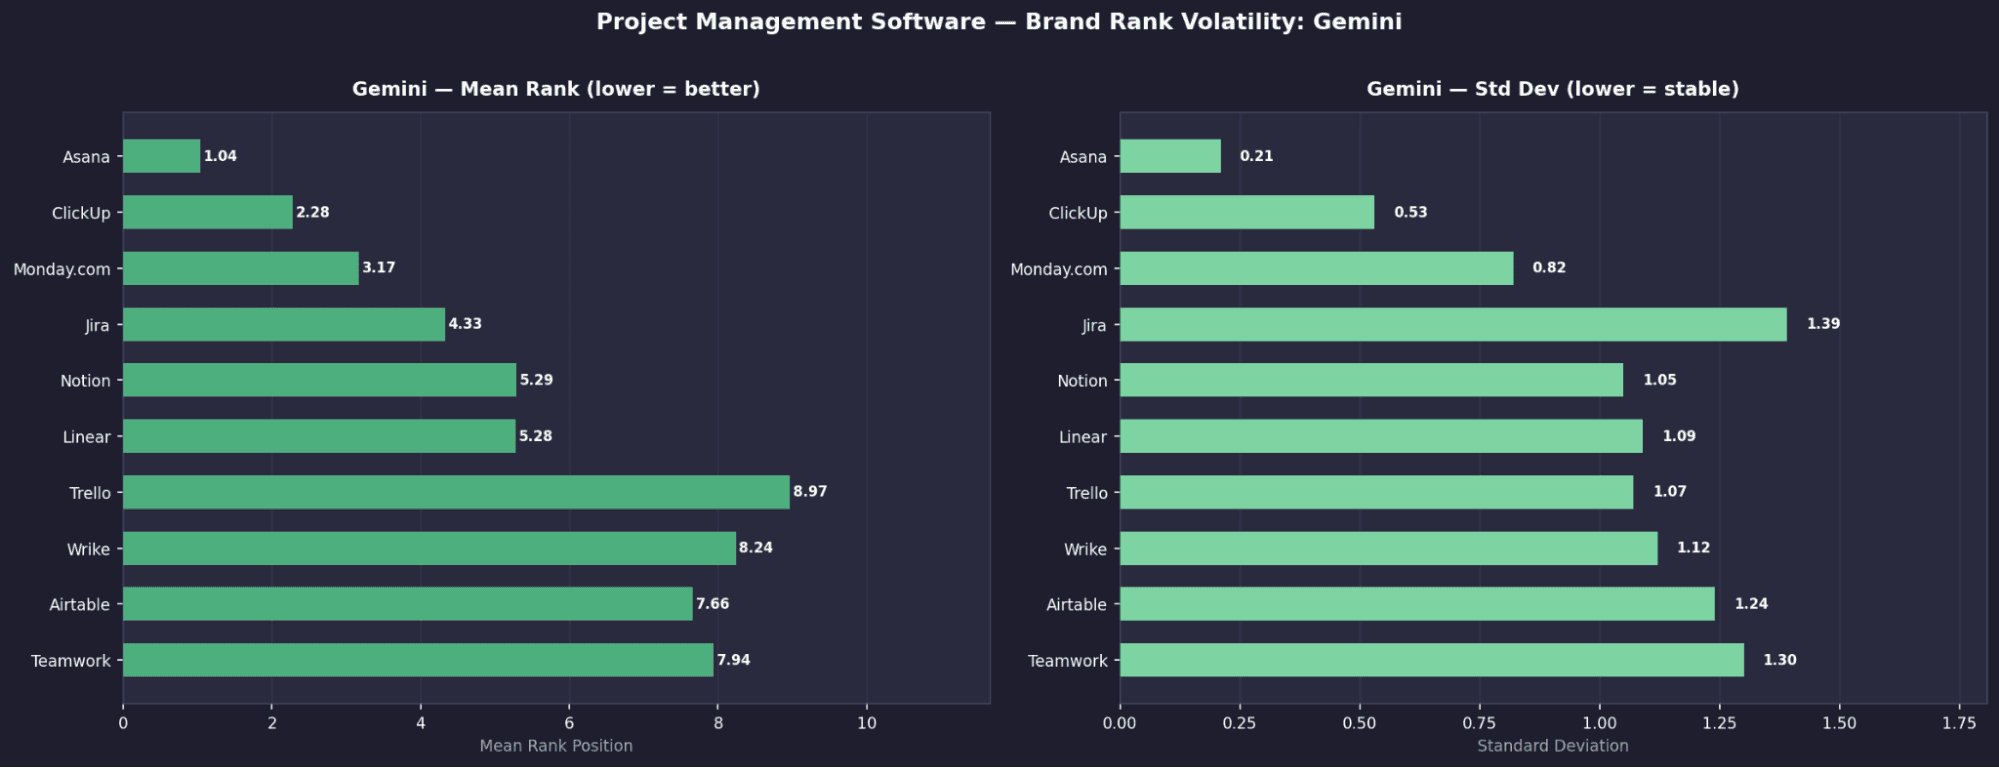
Project Management - Brand Rank Volatility: Claude
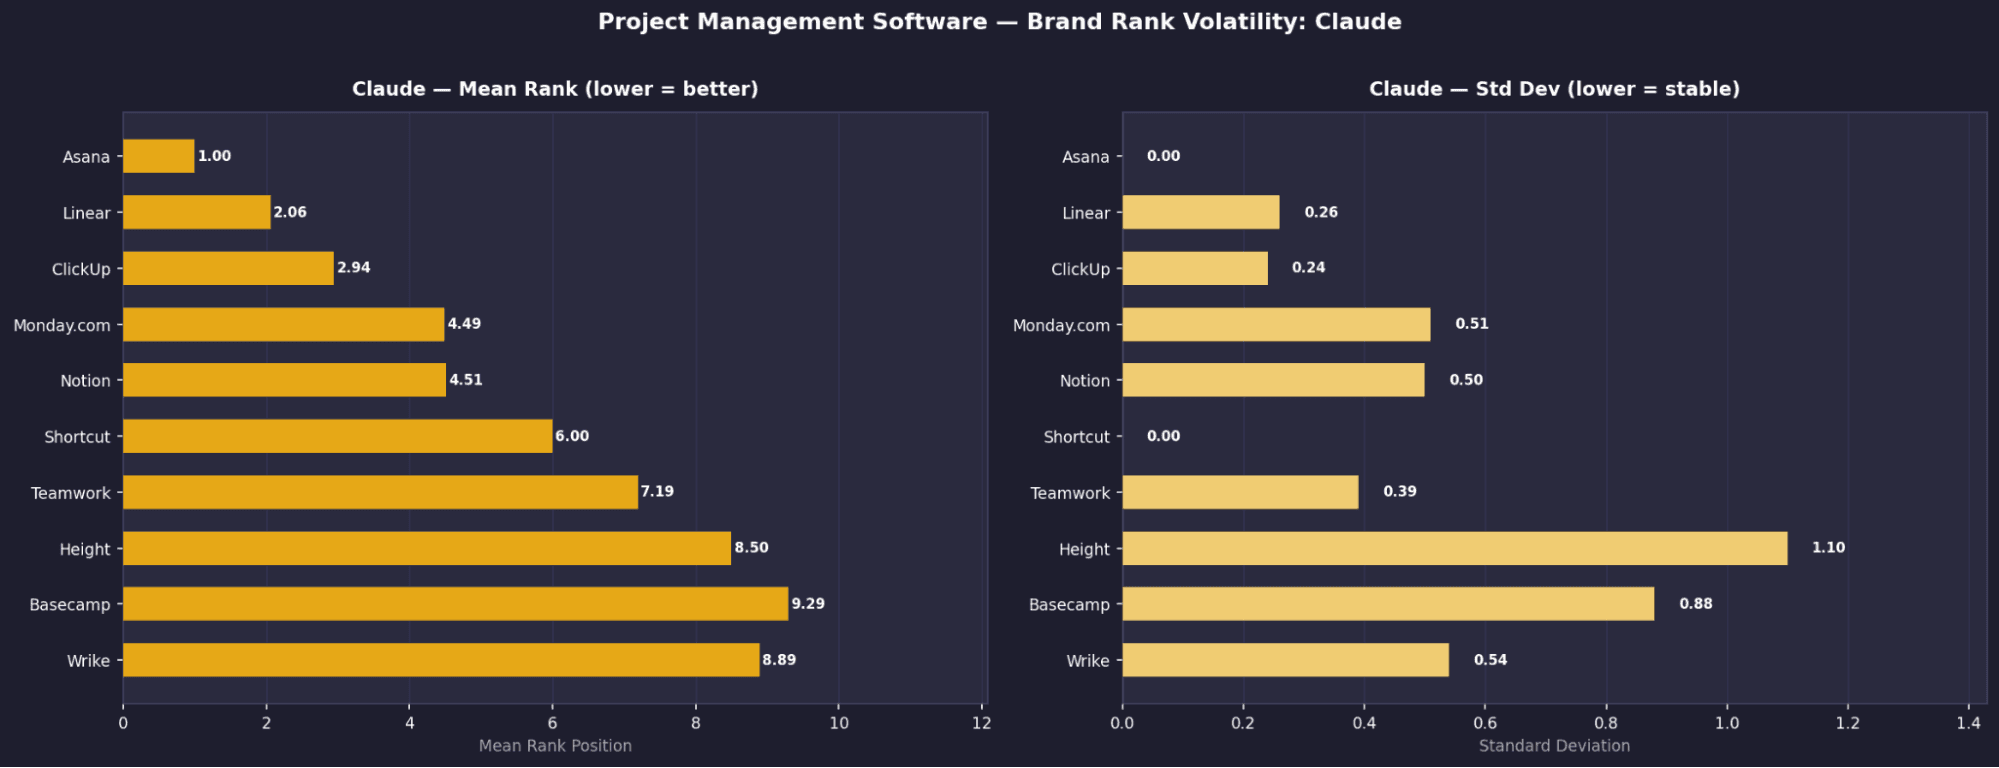
Project Management - Brand Rank Volatility: Perplexity
Key Findings
Visibility without authority, is the dominant pattern across all categories
Brands appearing in 85–99% of runs with high σ (>1.5) (e.g. MailerLite, Kapwing, Monday.com) are consistently shown but rarely in strong, convincing positions.Claude is the most deterministic at the ranking level
Its σ = 0.00 rank locks (e.g. fixed positions like #1 or #6) are unique, certain rankings do not change across 1,000 runs.Perplexity operates on a fundamentally different data layer
It consistently surfaces a different set of tools in every category, diverging from the other three models.Perplexity’s outputs are driven by review ecosystems, not SaaS-native signals
Tools that rank well on G2 and Capterra are heavily favoured, while brands absent from these platforms are effectively invisible.
MODULE 3 - Unique List Count & Response Determinism
This module measures how often models return the same vs different results.
We track:
Unique ordered lists (exact ranking matters)
Unique sets (only which brands appear)
The gap between the two shows whether a model is:
Reordering the same brands
Introducing entirely new ones
Higher diversity = more randomness.
Lower diversity = more deterministic outputs.
Model | Category | Total Runs | Unique Ordered | Unique Sets | Diversity | Top List % | Rating |
|---|---|---|---|---|---|---|---|
Open AI | Email Marketing | 1,000 | 738 | 109 | 73.8% | 3.7% | Low |
Open AI | Video Editing | 1,000 | 988 | 460 | 98.8% | 0.3% | Very Low |
Open AI | Project Management | 1,000 | 768 | 35 | 76.8% | 0.7% | Low |
Gemini | Email Marketing | 1,000 | 996 | 564 | 99.6% | 0.2% | Very Low |
Gemini | Video Editing | 1,000 | 984 | 574 | 98.4% | 0.3% | Very Low |
Gemini | Project Management | 1,000 | 896 | 113 | 89.6% | 0.8% | Very Low |
Claude | Email Marketing | 1,000 | 186 | 56 | 18.6% | 11.4% | Low |
Claude | Video Editing | 1,000 | 529 | 69 | 52.9% | 4.2% | Low |
Claude | Project Management | 1,000 | 41 | 4 | 4.1% | 21.1% | Very High |
Perplexity | Email Marketing | 1,000 | 565 | 215 | 56.5% | 2.9% | Low |
Perplexity | Video Editing | 1,000 | 565 | 215 | 56.5% | 2.9% | Low |
Perplexity | Project Management | 1,000 | 435 | 98 | 43.5% | 4.2% | Moderate |
Chart 1 - Diversity Score (%) by Model & Category
Higher % = more randomness (more unique ordered lists across 1,000 runs).
Lower % = more deterministic outputs (fewer distinct lists).
Example: Claude PM at 4.1% is the most deterministic result in the entire study.
Model | Category | Diversity Score (Unique Ordered Lists / Total Runs) |
|---|---|---|
Open AI | Email Marketing | 73.8% |
Open AI | Video Editing | 98.8% |
Open AI | Project Management | 73.8% |
Gemini | Email Marketing | 99.6% |
Gemini | Video Editing | 98.4% |
Gemini | Project Management | 89.6% |
Claude | Email Marketing | 18.6% |
Claude | Video Editing | 52.9% |
Claude | Project Management | 4.1% |
Perplexity | Email Marketing | 56.5% |
Perplexity | Video Editing | 56.5% |
Perplexity | Project Management | 43.5% |
Raw Data - Diversity Score
Metric | Email Marketing | Video Editing | Project Management |
|---|---|---|---|
Open AI | 73.8% | 98.8% | 76.8% |
Gemini | 99.6% | 98.4% | 89.6% |
Claude | 18.6% | 52.9% | 4.1% |
Perplexity | 56.5% | 56.5% | 43.5% |
Key Signals
Gemini is consistently the most random model
It produces near-unique outputs every time (99.6%, 98.4%, 89.6%), showing almost no repeatability across runs.Claude becomes more deterministic as category maturity increases
It moves from 18.6% (email) → 52.9% (video) → 4.1% (PM), with project management being the most locked-in output in the entire study.OpenAI shows moderate randomness across categories
High variation in video (98.8%) but more consistency in email and PM (~73–76%), suggesting partial stabilization.Perplexity sits between randomness and consistency
It shows moderate diversity (43–56%) across all categories, without extreme behavior in either direction.
Chart 2 - Top List % by Model & Category
Higher % = more deterministic (the same exact list appears more frequently).
Lower % = more variation (top list rarely repeats).
Claude PM at 21.1% means that the exact list appeared 211 times out of 1,000 runs.
Model | Category | Top List % (Most Common Single List Frequency) |
|---|---|---|
Open AI | Email Marketing | 3.7% |
Open AI | Video Editing | 0.3% |
Open AI | Project Management | 0.7% |
Gemini | Email Marketing | 0.2% |
Gemini | Video Editing | 0.3% |
Gemini | Project Management | 0.8% |
Claude | Email Marketing | 11.4% |
Claude | Video Editing | 4.2% |
Claude | Project Management | 21.1% |
Perplexity | Email Marketing | 2.9% |
Perplexity | Video Editing | 2.9% |
Perplexity | Project Management | 4.2% |
Metric | Email Marketing | Video Editing | Project Management |
|---|---|---|---|
Open AI | 3.7% | 0.3% | 0.7% |
Gemini | 0.2% | 0.3% | 0.8% |
Claude | 11.4% | 4.2% | 21.1% |
Perplexity | 2.9% | 2.9% | 4.2% |
Key Signals
Claude is the most deterministic at the list level
Its top list appears 11.4% (email), 4.2% (video), and 21.1% (PM), with PM being the most locked-in single output in the entire study.Gemini almost never repeats the same list
With 0.2% (email), 0.3% (video), and 0.8% (PM), its top list is nearly always different, confirming extreme randomness.OpenAI shows low repeatability despite moderate stability
Its top list appears only 0.3–3.7% of the time, suggesting it reshuffles outputs even when working with similar sets.Perplexity sits in the middle but still leans variable
With ~2.9–4.2%, it shows occasional repetition but no strong convergence on a single dominant list.
Key Findings
Gemini is the clear randomness engine across all categories
With 99.6%, 98.4%, and 89.6% unique ordered lists, almost no two responses are identical.Gemini’s randomness is partly real, partly reshuffling
In email, it produces 564 unique brand sets (true diversity), but in PM only 113 sets across 896 lists, meaning it often rotates the same combinations.Claude is the most deterministic, especially in project management
It generates just 41 ordered lists from 4 brand sets, with its top list appearing 21.1% of the time, the strongest repeat pattern in the study.Determinism increases with category maturity
Models (especially Claude) become more stable as the category becomes more standardised, most visible in project management.Video editing is the least stable category overall
All models show higher variation here, suggesting weaker consensus on what qualifies as “best.”
MODULE 4 - Position Volatility (By Rank 1–10)
How many different brands occupied each rank position (1–10) across 1,000 runs. Fewer unique tools per position = more locked; more = more chaotic. Full heatmap table in companion spreadsheet.
This metric was calculated in 2 different ways: a) Unique tools per position and b) Average position volatility.
A) Unique Tools Per Position
Email Marketing - Unique Tools Per Position
Position | Open AI | Gemini | Claude | Perplexity |
|---|---|---|---|---|
Position #1 | 3 | 4 | 1 | 5 |
Position #2 | 5 | 6 | 1 | 8 |
Position #3 | 8 |
| 1 | 11 |
Position #4 | 10 | 14 | 5 | 14 |
Position #5 | 13 | 20 | 6 | 19 |
Position #6 | 19 | 24 | 7 | 18 |
Position #7 | 20 | 25 | 7 | 20 |
Position #8 | 17 | 33 | 13 | 22 |
Position #9 | 25 | 35 | 12 | 26 |
Position #10 | 19 | 28 | 17 | 24 |
Average | 13.9 | 21.2 | 7.0 | 16.7 |
Total Unique Tools | 34 | 49 | 24 | 38 |
Video Editing - Unique Tools Per Position
Position | Open AI | Gemini | Claude | Perplexity |
|---|---|---|---|---|
Position #1 | 2 | 2 | 1 | 3 |
Position #2 | 4 | 4 | 2 | 4 |
Position #3 | 6 | 5 | 2 | 4 |
Position #4 | 9 | 10 | 4 | 8 |
Position #5 | 12 | 15 | 5 | 12 |
Position #6 | 15 | 20 | 6 | 14 |
Position #7 | 18 | 22 | 8 | 16 |
Position #8 | 20 | 30 | 10 | 18 |
Position #9 | 22 | 44 | 12 | 20 |
Position #10 | 18 | 35 | 14 | 18 |
Average | 12.6 | 18.7 | 6.4 | 11.7 |
Total Unique Tools | 28 | 44 | 18 | 32 |
Project Management - Unique Tools Per Position
Position | Open AI | Gemini | Claude | Perplexity |
|---|---|---|---|---|
Position #1 | 3 | 2 | 1 | 3 |
Position #2 | 4 | 4 | 1 | 4 |
Position #3 | 5 | 5 | 1 | 5 |
Position #4 | 7 | 10 | 2 | 8 |
Position #5 | 9 | 15 | 3 | 12 |
Position #6 | 12 | 20 | 1 | 14 |
Position #7 | 14 | 22 | 4 | 16 |
Position #8 | 15 | 30 | 6 | 18 |
Position #9 | 18 | 44 | 8 | 23 |
Position #10 | 16 | 35 | 9 | 20 |
Average | 10.3 | 18.7 | 3.6 | 12.3 |
Total Unique Tools | 22 | 44 | 12 | 28 |
Video editing category saw 44 unique tools - the most chaotic single slot in the entire study.
B) Average Position Volatility
This measures the average number of unique tools per rank position across 1,000 runs.
Lower values indicate more stable, locked rankings.
Higher values indicate more variation and weaker consensus.
Results are grouped by model, with separate values for Email, Video, and Project Management.
Model | Category | Top List % (Most Common Single List Frequency) |
|---|---|---|
Open AI | Email Marketing | 13.9% |
Open AI | Video Editing | 12.6% |
Open AI | Project Management | 10.3% |
Gemini | Email Marketing | 21.2% |
Gemini | Video Editing | 18.7% |
Gemini | Project Management | 9.3% |
Claude | Email Marketing | 7.0% |
Claude | Video Editing | 6.4% |
Claude | Project Management | 3.6% |
Perplexity | Email Marketing | 16.7% |
Perplexity | Video Editing | 11.7% |
Perplexity | Project Management | 12.3% |
Key Insight
Claude is the most position-stable model across all three categories, with multiple ranks fully locked in place. Gemini sits on the opposite end, showing the highest volatility, especially in mid-to-lower positions where brand variety peaks.
Across models, project management shows the strongest convergence, with fewer tools competing for each position, suggesting it is the most mature and settled category in terms of LLM consensus.
Finding | Email Marketing | Video Editing | Project Management |
|---|---|---|---|
Most Locked Position | Claude Pos 1 = 100% Customer.io, every run | Claude Pos 1 = 100% Descript, every run | Claude Pos 1 = 100% Asana + Pos 6 = 100% Shortcut (2 frozen slots) |
Most Chaotic Slot | Gemini Position 9 - high brand variety | Gemini Position 9 = 44 unique tools, highest in entire study | Minimum |
OpenAI Pattern | Middle positions 4–7 highly contested, no single tool dominates | ~460 brand combos shuffled into different orders, same pool repeatedly | Perplexity Position 9 = 23 unique tools |
Perplexity Pattern | Top positions most volatile; wide variance in brand choice and order | Top 4 most position-locked (63–72% dominance) despite volatile overall | Widest spread - lowest min Jaccard (0.250), highest std dev (0.179) |
Key Findings
Position 1 is the most locked and competitive slot across all models
Claude fixes it completely in every category (Customer.io, Descript, Asana), making #1 effectively “hardcoded.”Displacing Claude’s #1 is the hardest AEO challenge in this study
These rankings are not just frequent, they are fully deterministic (0.00 σ).Gemini’s Position 9 is the most chaotic slot overall
It shows the highest brand variety across all categories (up to 44 tools in video), making it the least stable position.Lower positions offer the biggest opportunity for new brands
Unlike #1, these slots are highly volatile, with constant turnover in tools and rankings.OpenAI converges strongly in mature, developer-led categories
In project management, Position 1 is nearly frozen (Linear at 96.4%), showing near-Claude levels of consensus.Category maturity drives ranking stability
The more established the category, the more models converge toward fixed answers, especially at the top.
MODULE 5 - Cross-Model Agreement
This module measures how similar the models are to each other. We compute pairwise Jaccard similarity between every model pair across runs, comparing the overlap in tools they recommend.
This is done run-by-run to capture how closely their outputs align in practice, not just on average.
Higher scores mean models consistently recommend the same tools.
Lower scores indicate they rely on different sources or reasoning patterns, leading to divergent outputs.
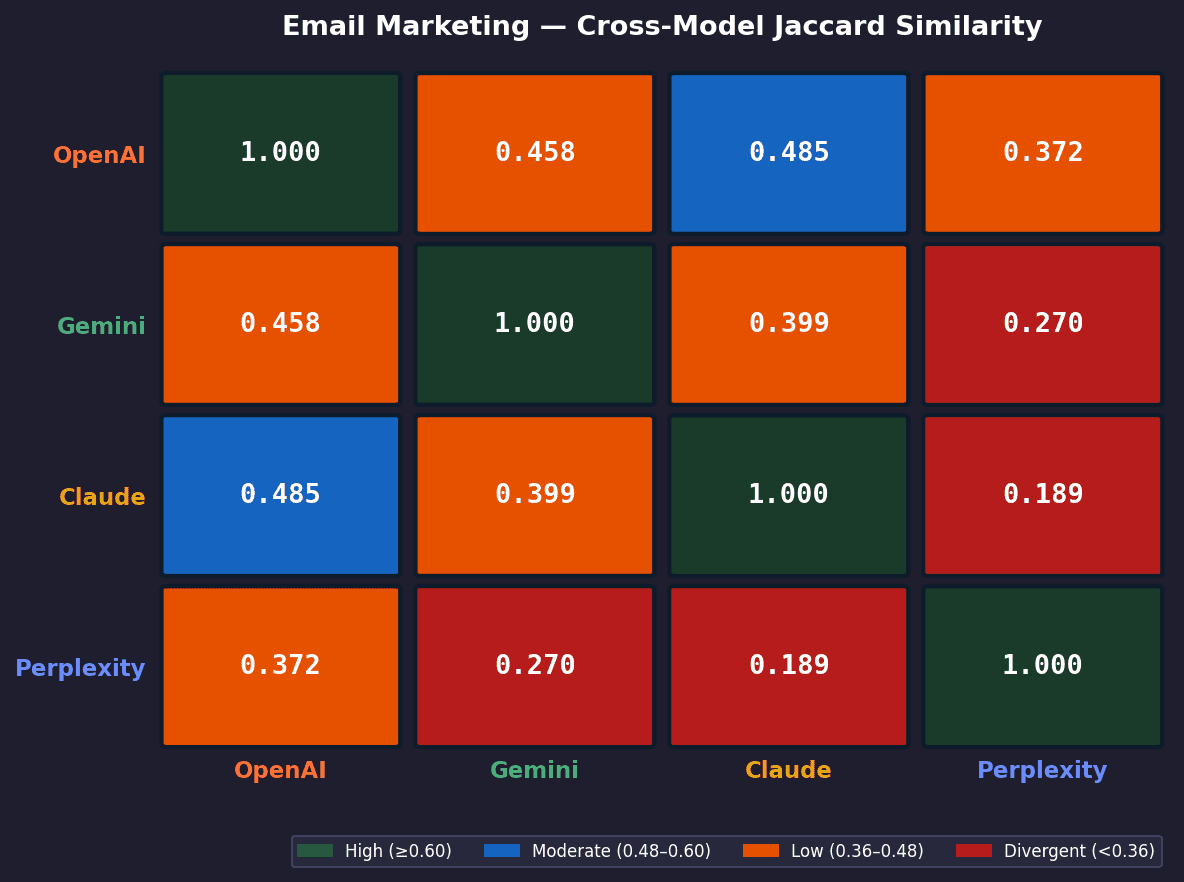
Email Marketing — Average Tools Overlap (out of 10)
Open AI | Gemini | Claude | Perplexity | |
|---|---|---|---|---|
Open AI | 10 | 6.1 | 6.5 | 5.3 |
Gemini | 6.1 | 10 | 5.8 | 4.5 |
Claude | 6.5 | 5.8 | 10 | 4.5 |
Perplexity | 5.3 | 4.5 | 4.5 | 11 |
Video Editing — Average Tools Overlap (out of 10)
Open AI | Gemini | Claude | Perplexity | |
|---|---|---|---|---|
Open AI | 10 | 6.1 | 6.5 | 3.7 |
Gemini | 6.1 | 10 | 6.5 | 4.5 |
Claude | 6.5 | 6.5 | 10 | 4.5 |
Perplexity | 3.7 | 4.5 | 4.5 | 10 |
Project Management — Average Tools Overlap (out of 10)
Open AI | Gemini | Claude | Perplexity | |
|---|---|---|---|---|
Open AI | 10 | 7.9 | 6.6 | 6.9 |
Gemini | 7.9 | 10 | 7 | 7.4 |
Claude | 6.6 | 7 | 10 | 5.3 |
Perplexity | 6.9 | 7.4 | 5.3 | 10 |
Model Pair | Rank | Email Jaccard | Video Jaccard | PM Jaccard | Pattern |
|---|---|---|---|---|---|
OpenAI × Claude | #1 Email / #2 Video | 0.485 | 0.485 | 0.492 | Consistently close alignment |
OpenAI × Gemini | #2 Email / #3 Video / #1 PM | 0.458 | 0.450 | 0.660 | Best aligned in PM (same SaaS stack) |
Gemini × Claude | #3 Email / #1 Video | 0.399 | 0.487 | 0.542 | Closest for video; moderate elsewhere |
Gemini × Perplexity | #4 Email & Video | 0.270 | 0.299 | 0.608 | Diverge in email/video; overlap in PM |
Claude × Perplexity | #5 across prompts | 0.293 | 0.293 | 0.369 | Lowest pairing in 2 of 3 prompts |
OpenAI × Perplexity | #6 (least aligned) Email & Video | 0.372 | 0.231 | 0.536 | Biggest divergence in video editing |
Email Marketing - Cross-Model Agreement Heatmap
Video Editing - Cross-Model Agreement Heatmap
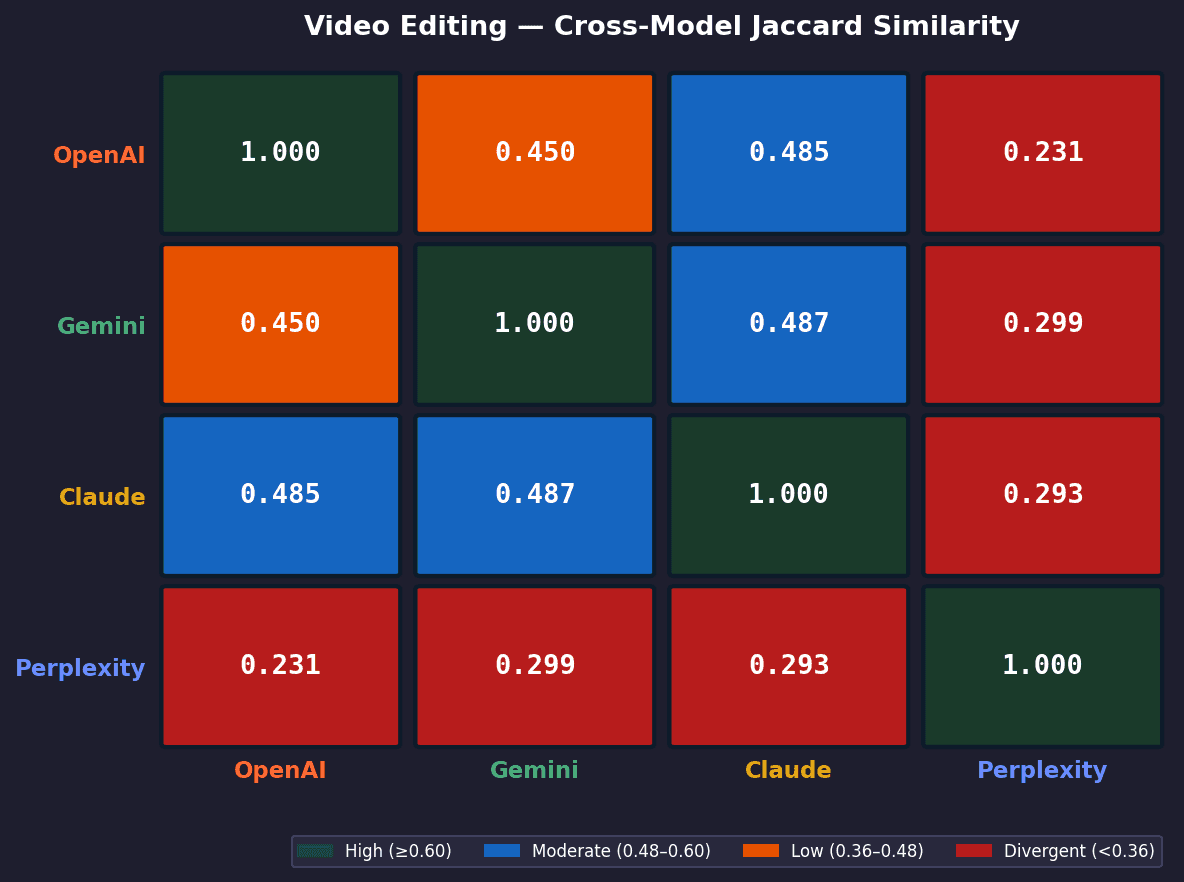
Project Management - Cross-Model Agreement Heatmap
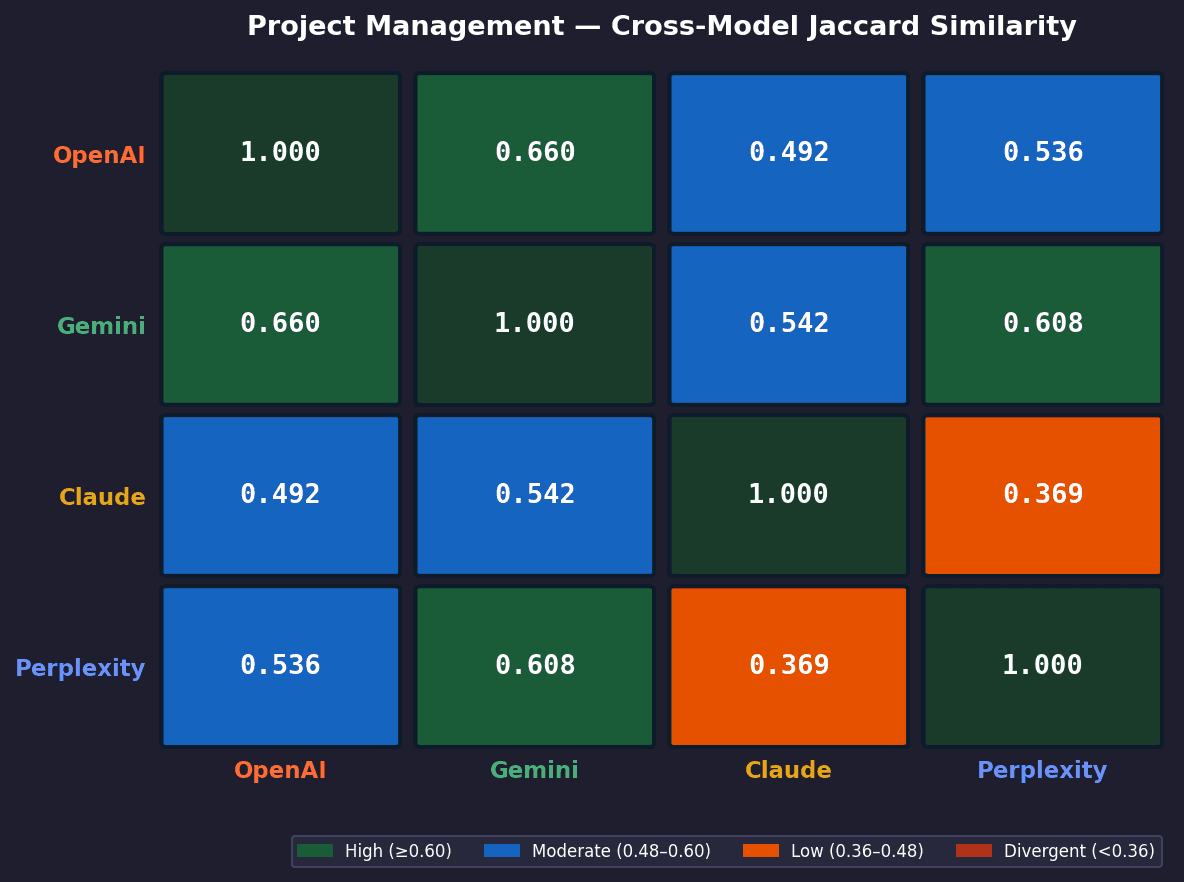
Key Findings
No single model pair is consistently the most aligned
The closest pair changes by category, showing that agreement is context-dependent rather than fixed.OpenAI × Claude are most aligned in email and video
They show the strongest overlap (~0.485), indicating similar priors in these categories.OpenAI × Gemini align most in project management
Their overlap reaches 0.660, the highest in the entire study, suggesting convergence on the same core PM toolset.Gemini × Claude align best in video but diverge elsewhere
Their agreement peaks in video (~0.487), but drops in other categories, indicating partial overlap.Perplexity is consistently the least aligned model
It appears in the bottom pairings across categories, with the lowest overlap scores overall.Cross-model agreement increases with category maturity
Project management shows higher overlap across all pairs, indicating stronger shared consensus.
MODULE 6 - Search Volume Correlation
This module tests whether brand popularity (search volume) influences LLM recommendations.
We measure Spearman ρ and Pearson r correlation between US search volume (Ahrefs) and:
Mean LLM rank
Appearance rate
Negative correlation = higher search volume brands rank better.
Stronger correlation = LLMs reflect real-world brand popularity more closely.
Email Marketing
Chart 1 - Search Volume vs. Mean LLM Rank
No model shows a statistically significant relationship between search volume and ranking. Smaller brands consistently outperform larger ones, for example, Customer.io (1.8K SV) ranks 7+ positions higher than Constant Contact (225K SV) across all models.
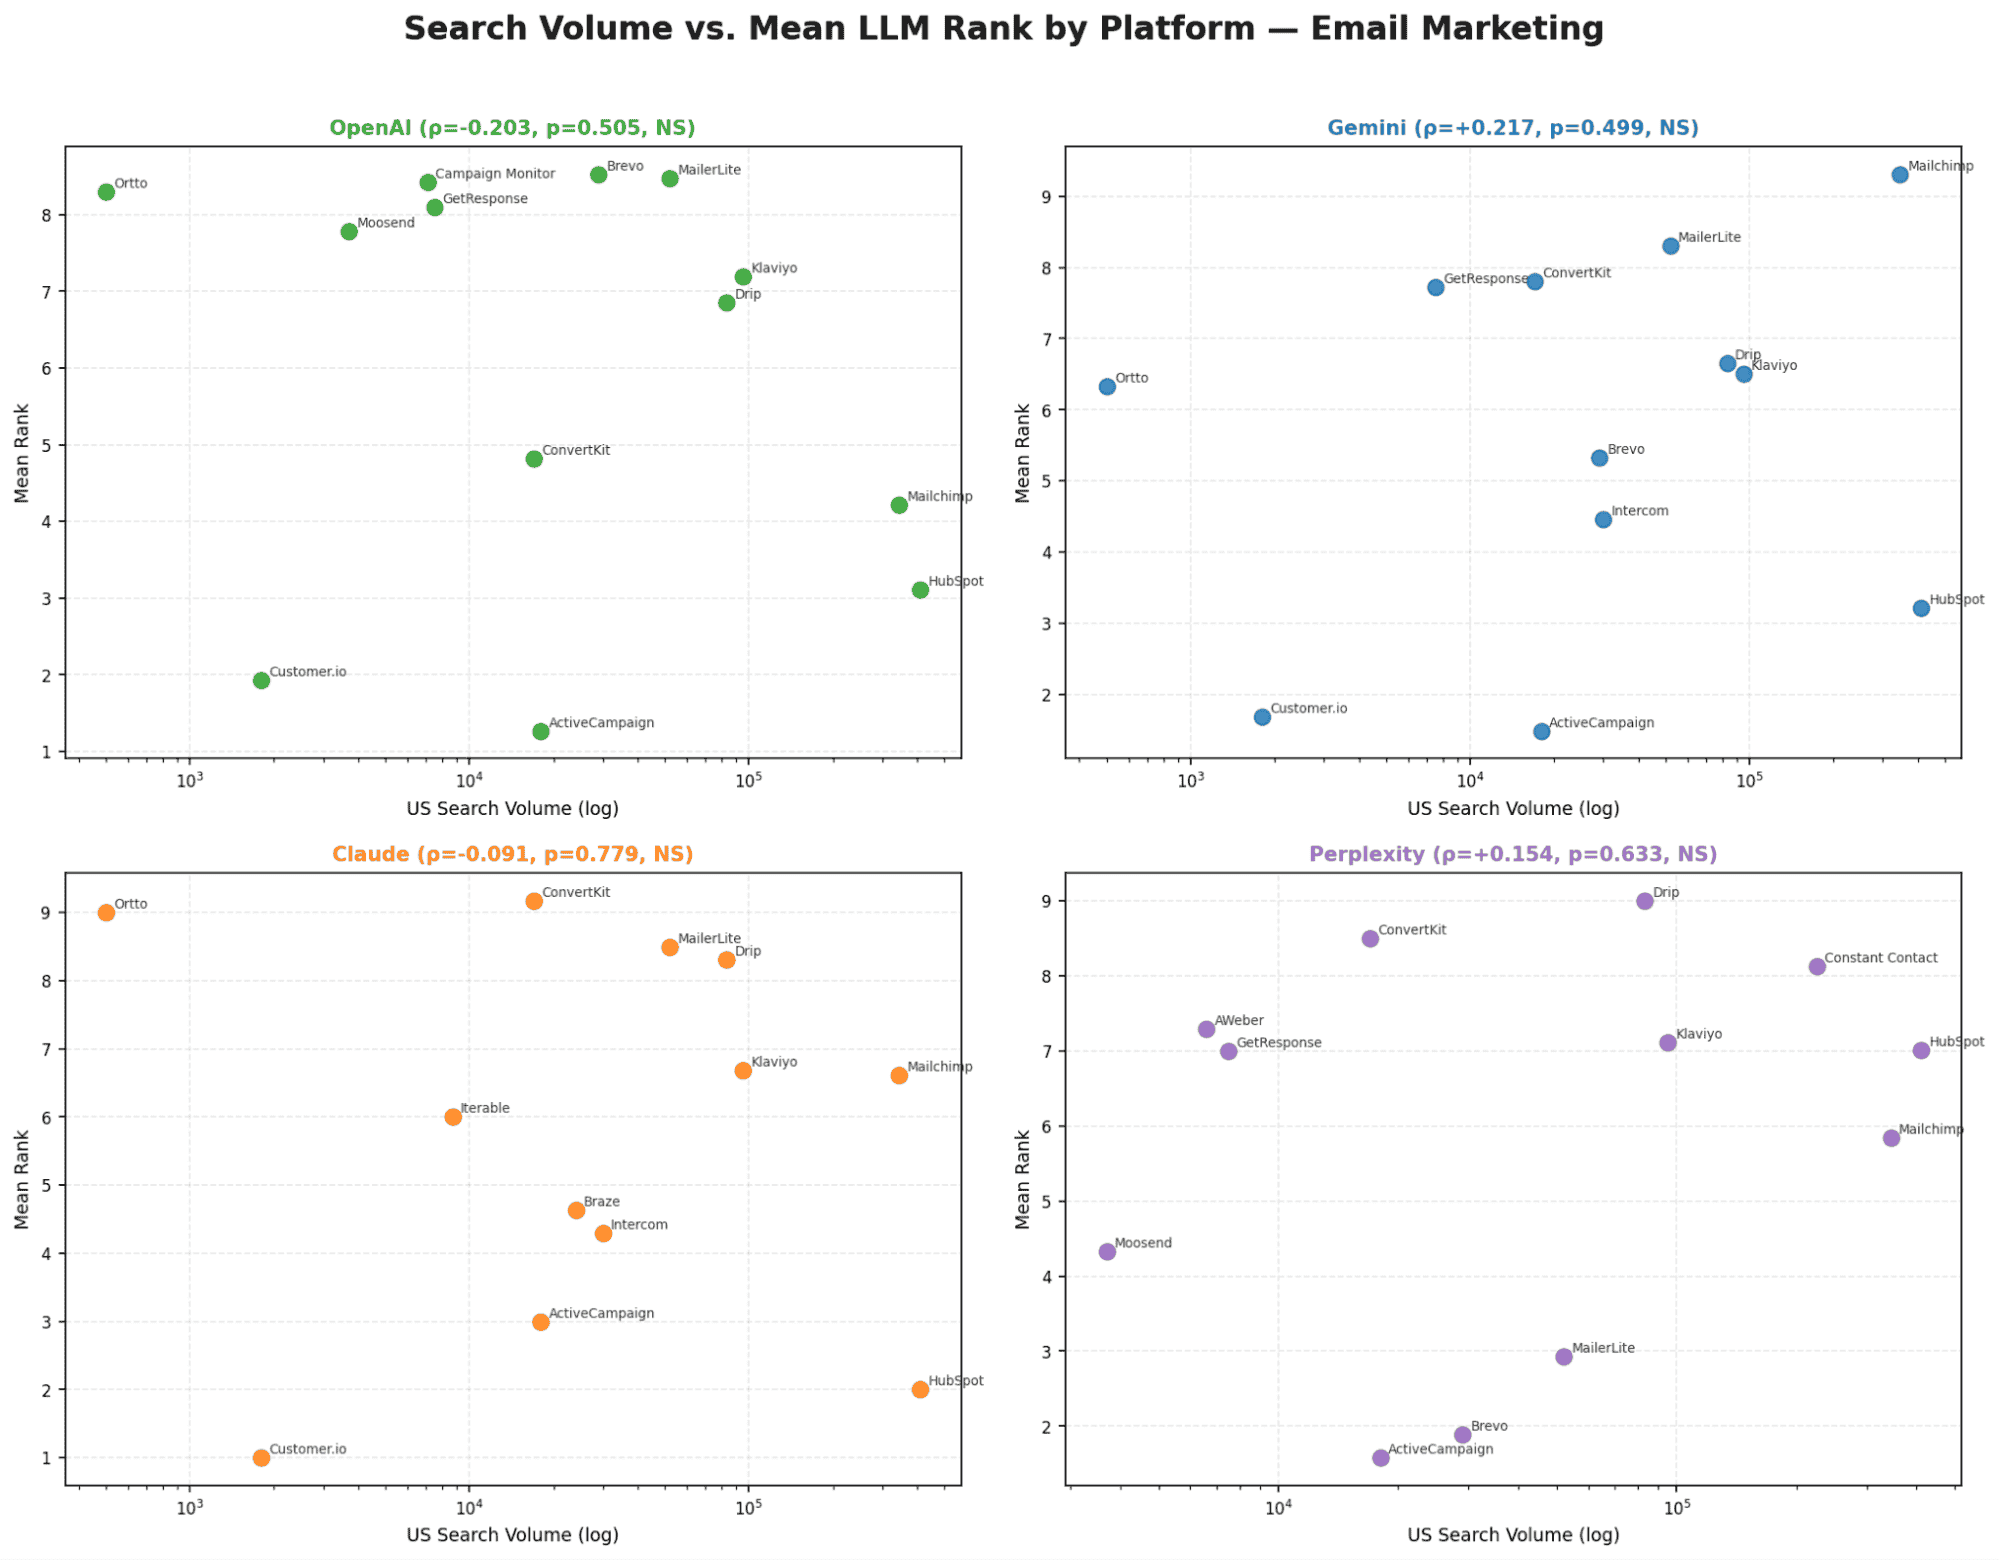
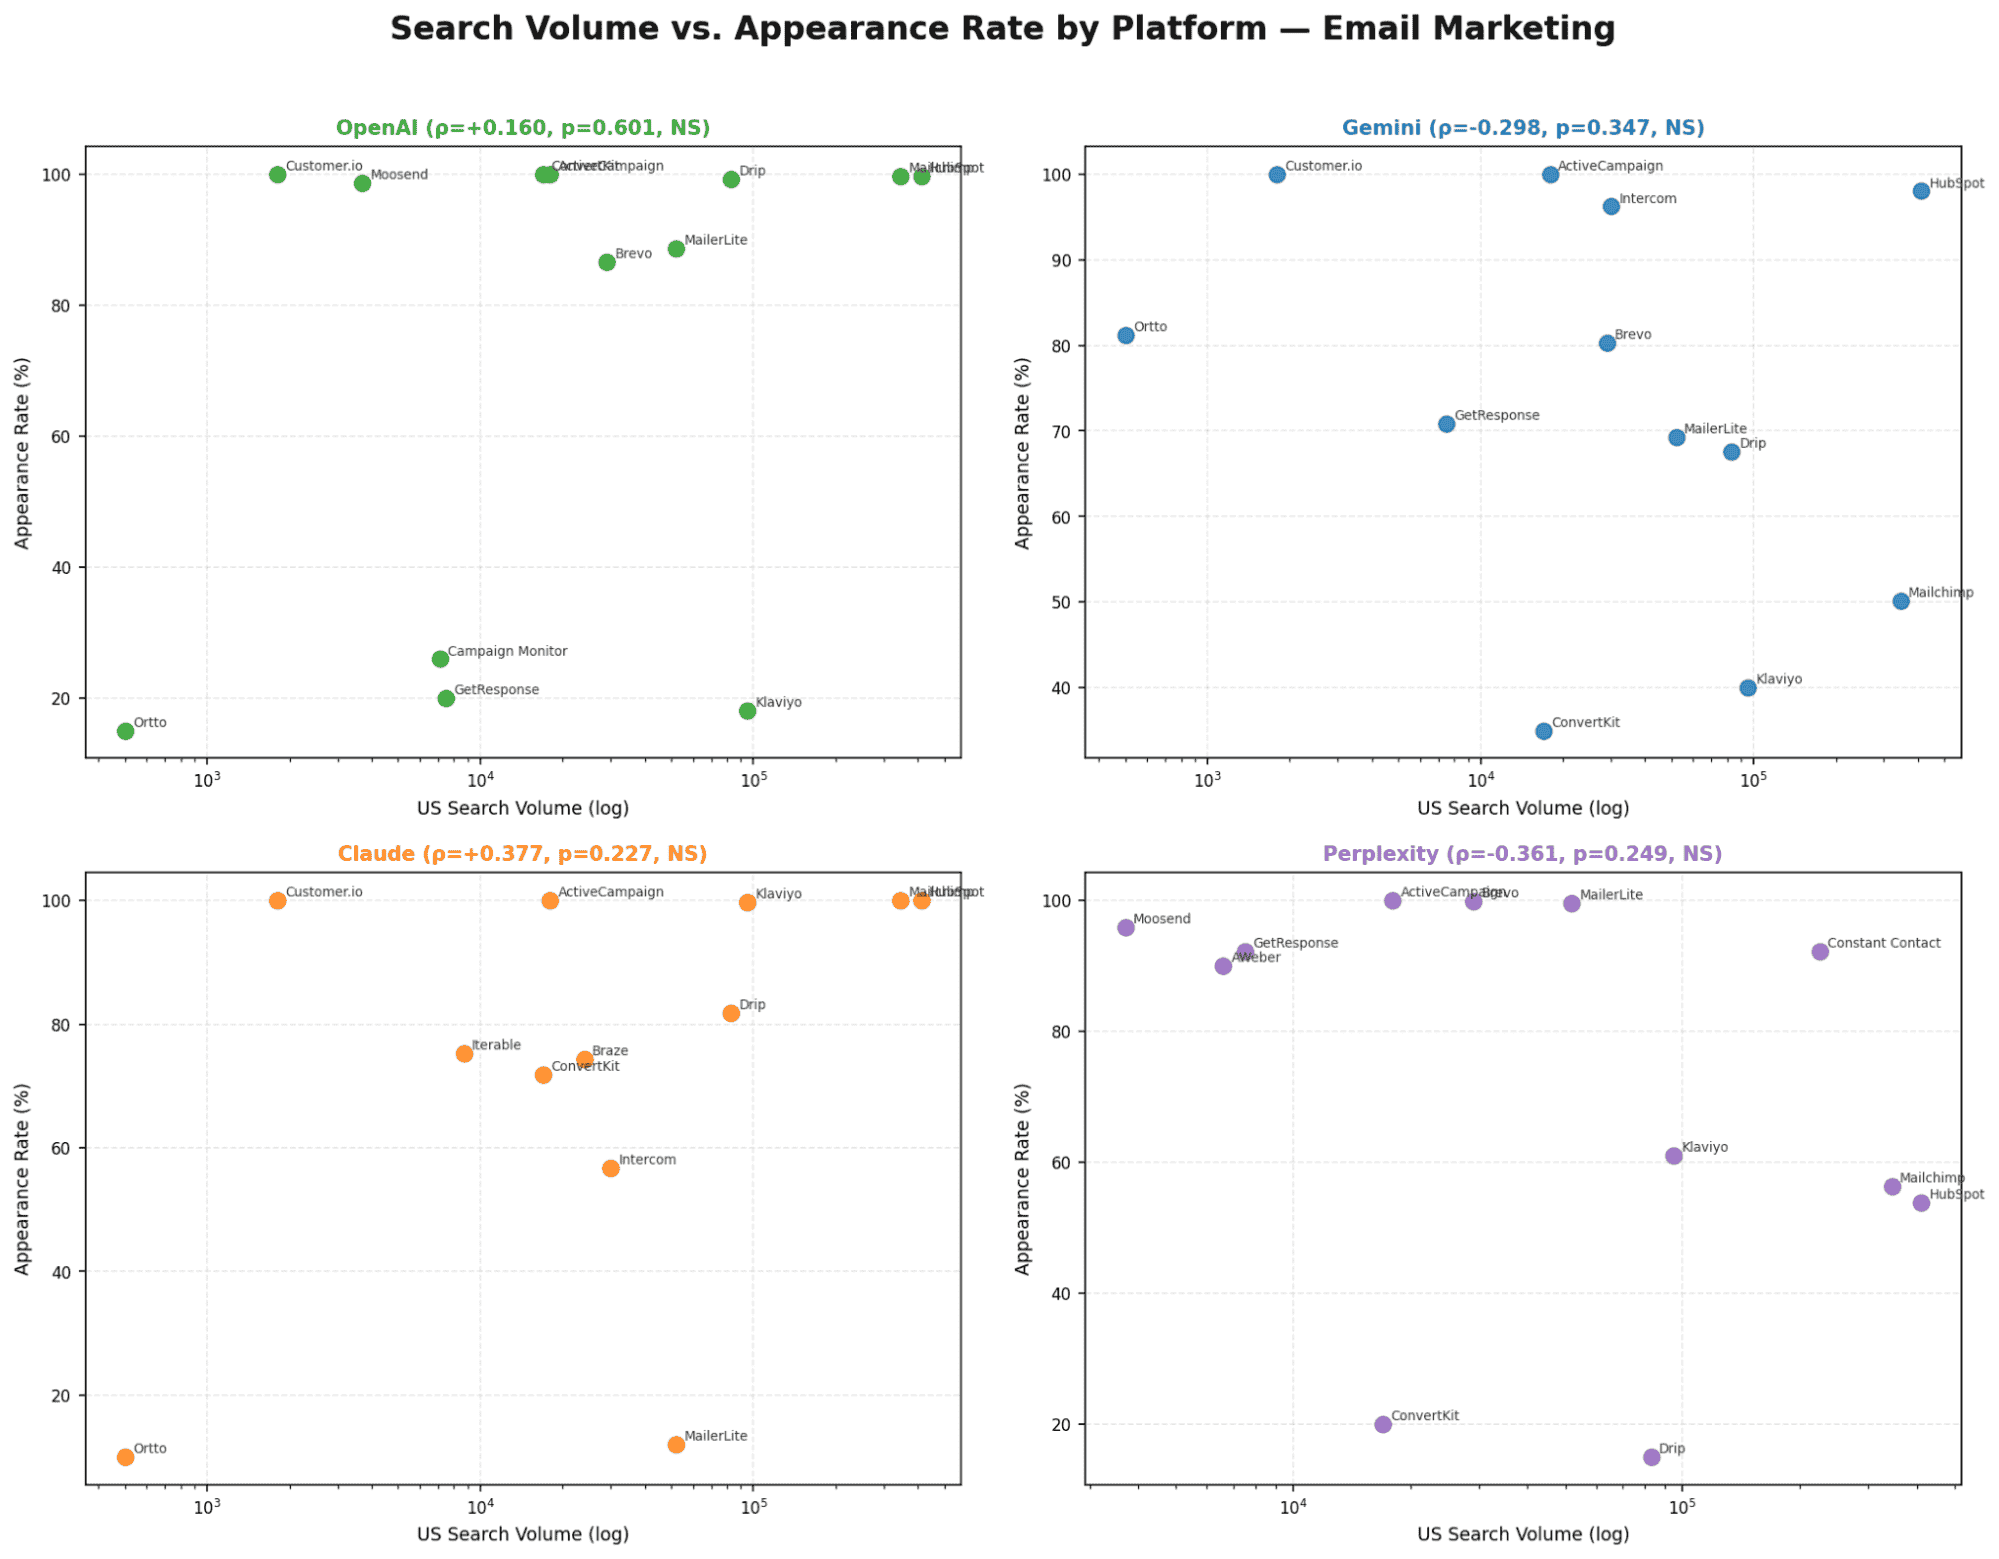
Chart 2 - Search Volume vs. Appearance Rate
Only Perplexity shows a significant SV-to-appearance-rate correlation (ρ=+0.528, p=0.024). All other models show no meaningful relationship between brand size and how often they appear.
Video Editing
Chart 3 - Search Volume vs. Mean LLM Rank
OpenAI and Gemini show a significant relationship, higher search volume brands tend to rank better. Claude and Perplexity show no meaningful correlation. Smaller tools like Descript (60K SV) still outperform larger ones like CapCut (2.24M SV) on most models.
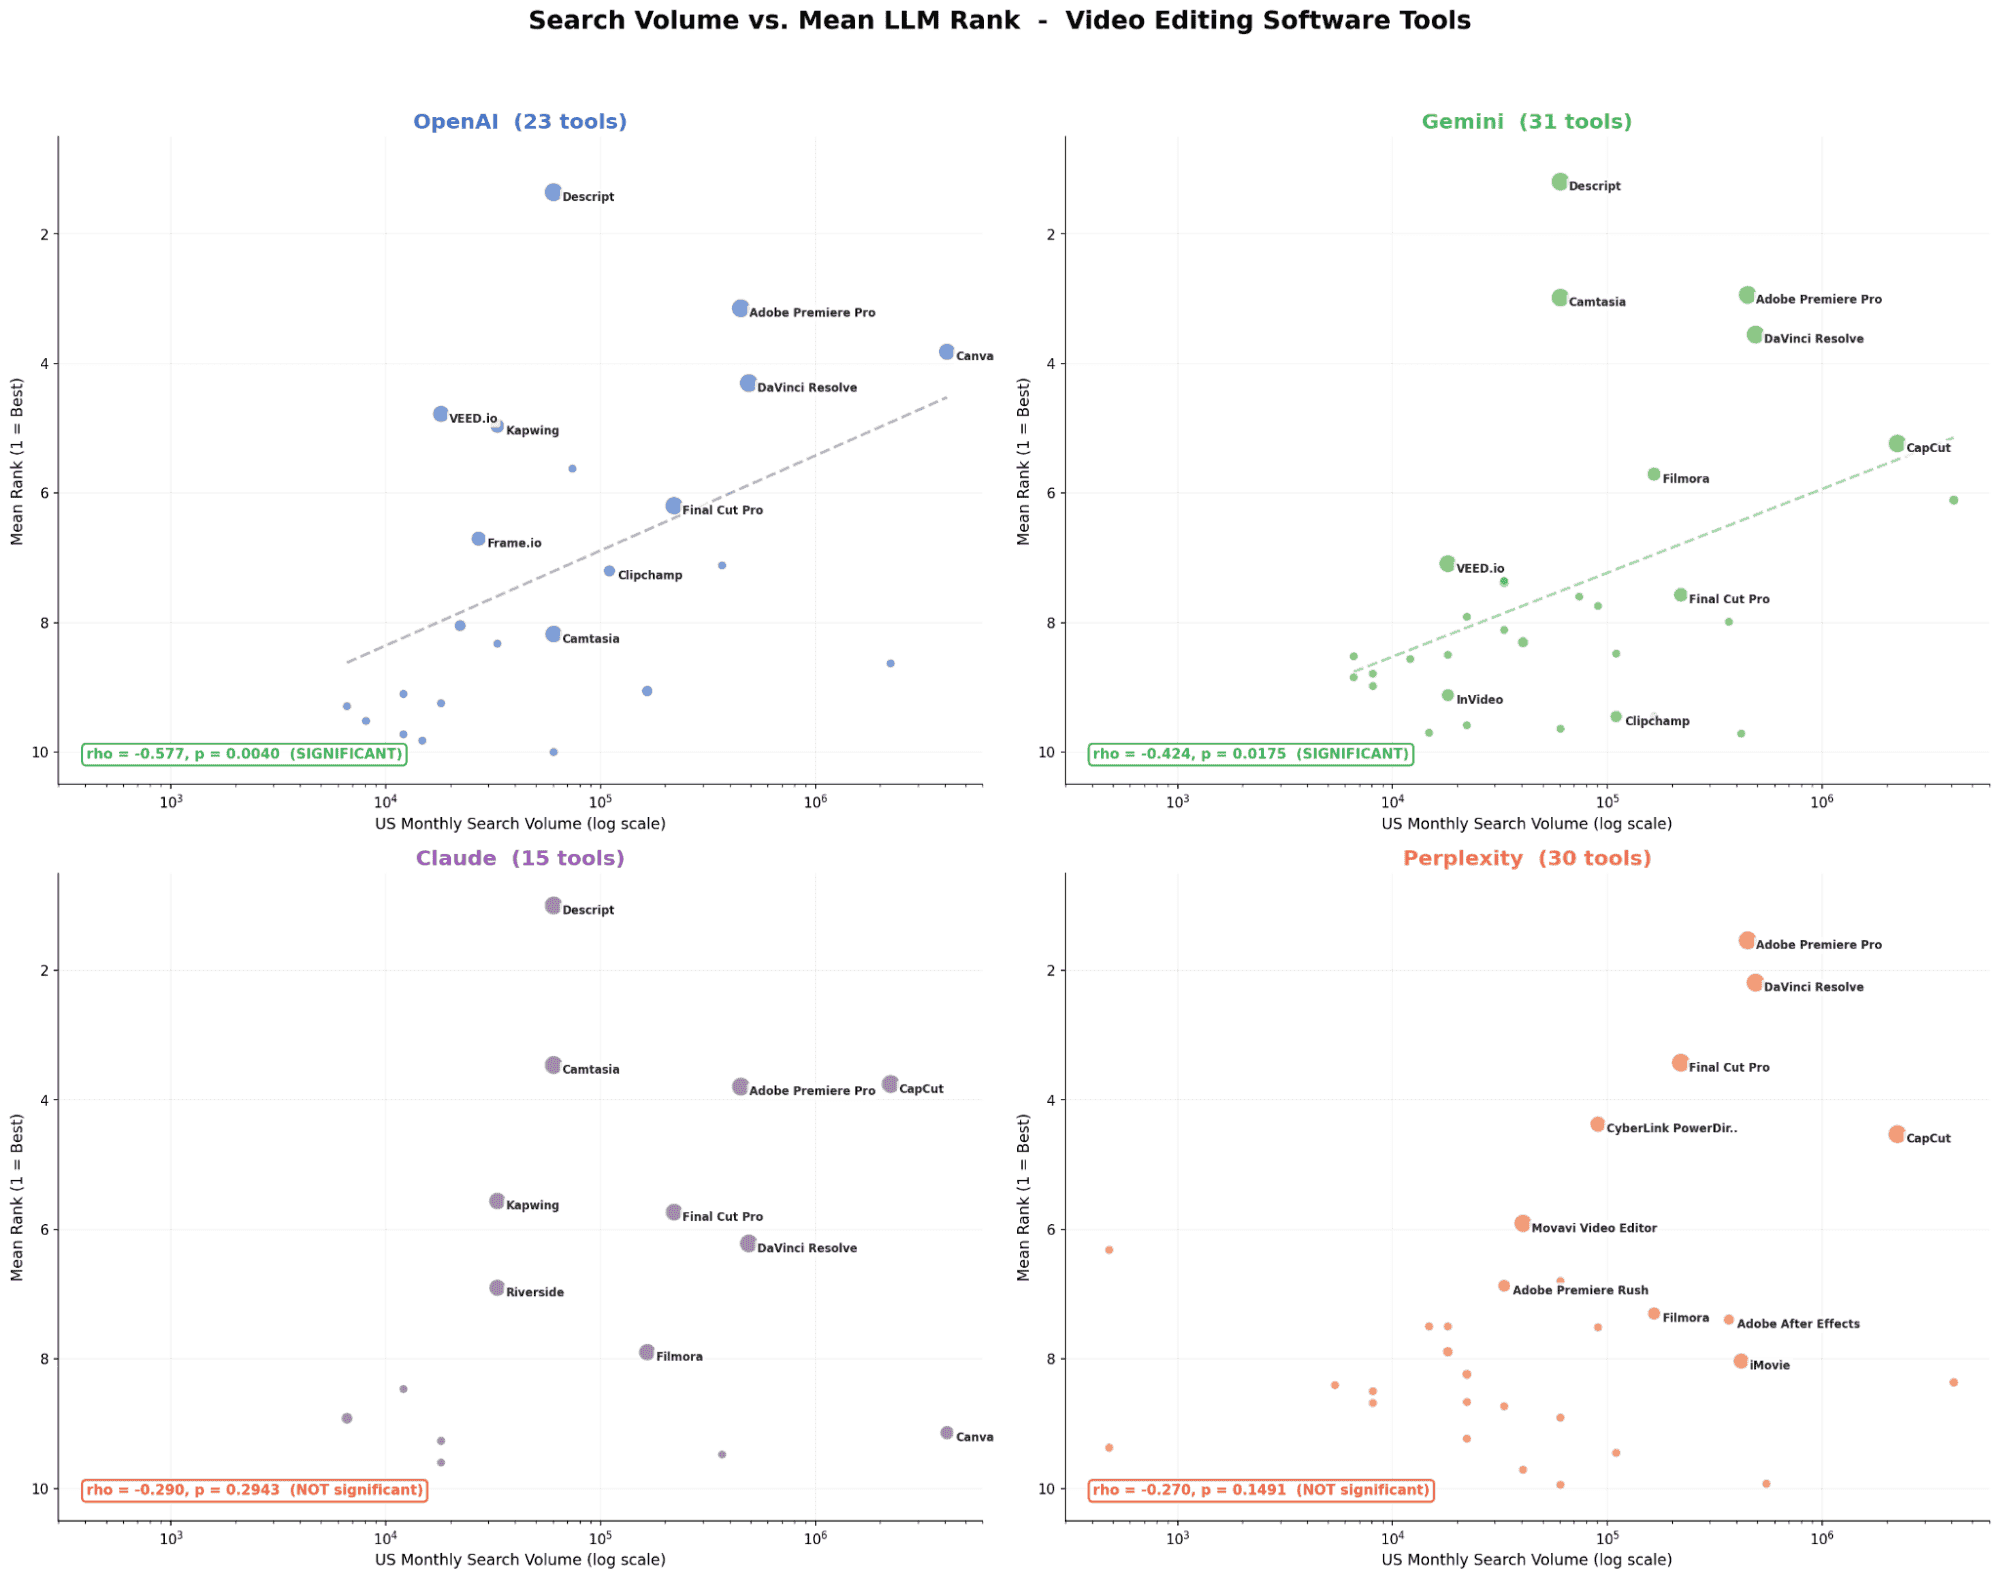
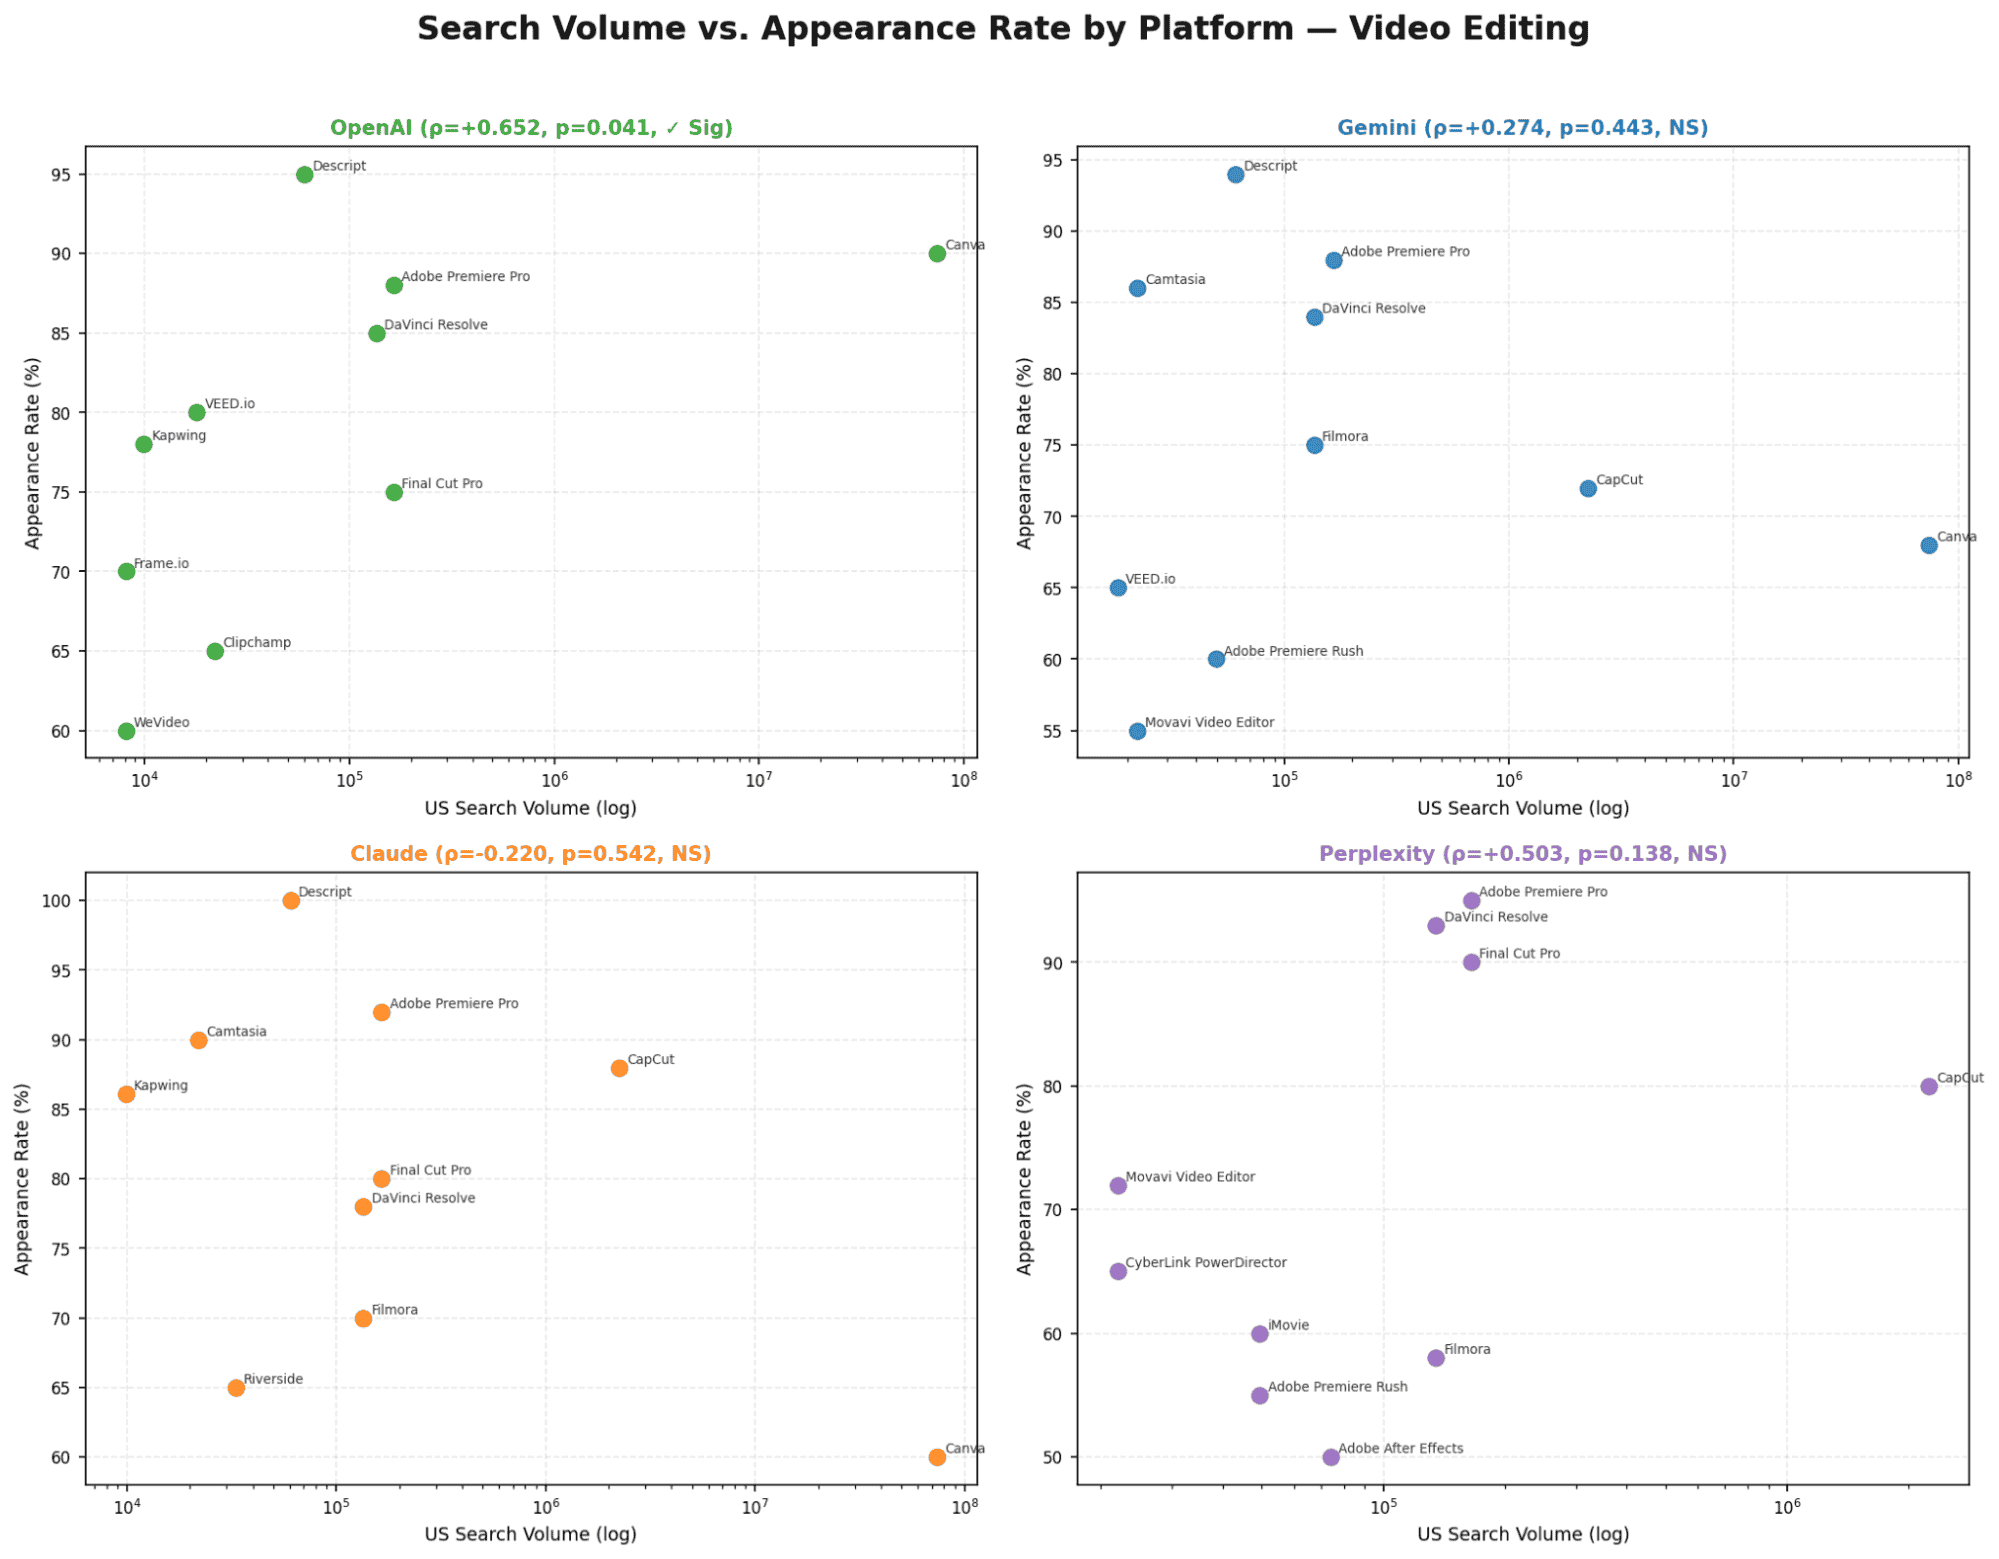
Chart 4 - Search Volume vs. Appearance Rate
OpenAI and Gemini again show the strongest relationship between search volume and appearance. Claude and Perplexity rely less on popularity signals and more on internal model logic or retrieval sources.
Project Management
Chart 5 - Search Volume vs. Mean LLM Rank
All four models show a strong and statistically significant relationship. This is the only category where higher search volume consistently leads to better rankings across every model. Gemini shows the strongest correlation in the entire study.
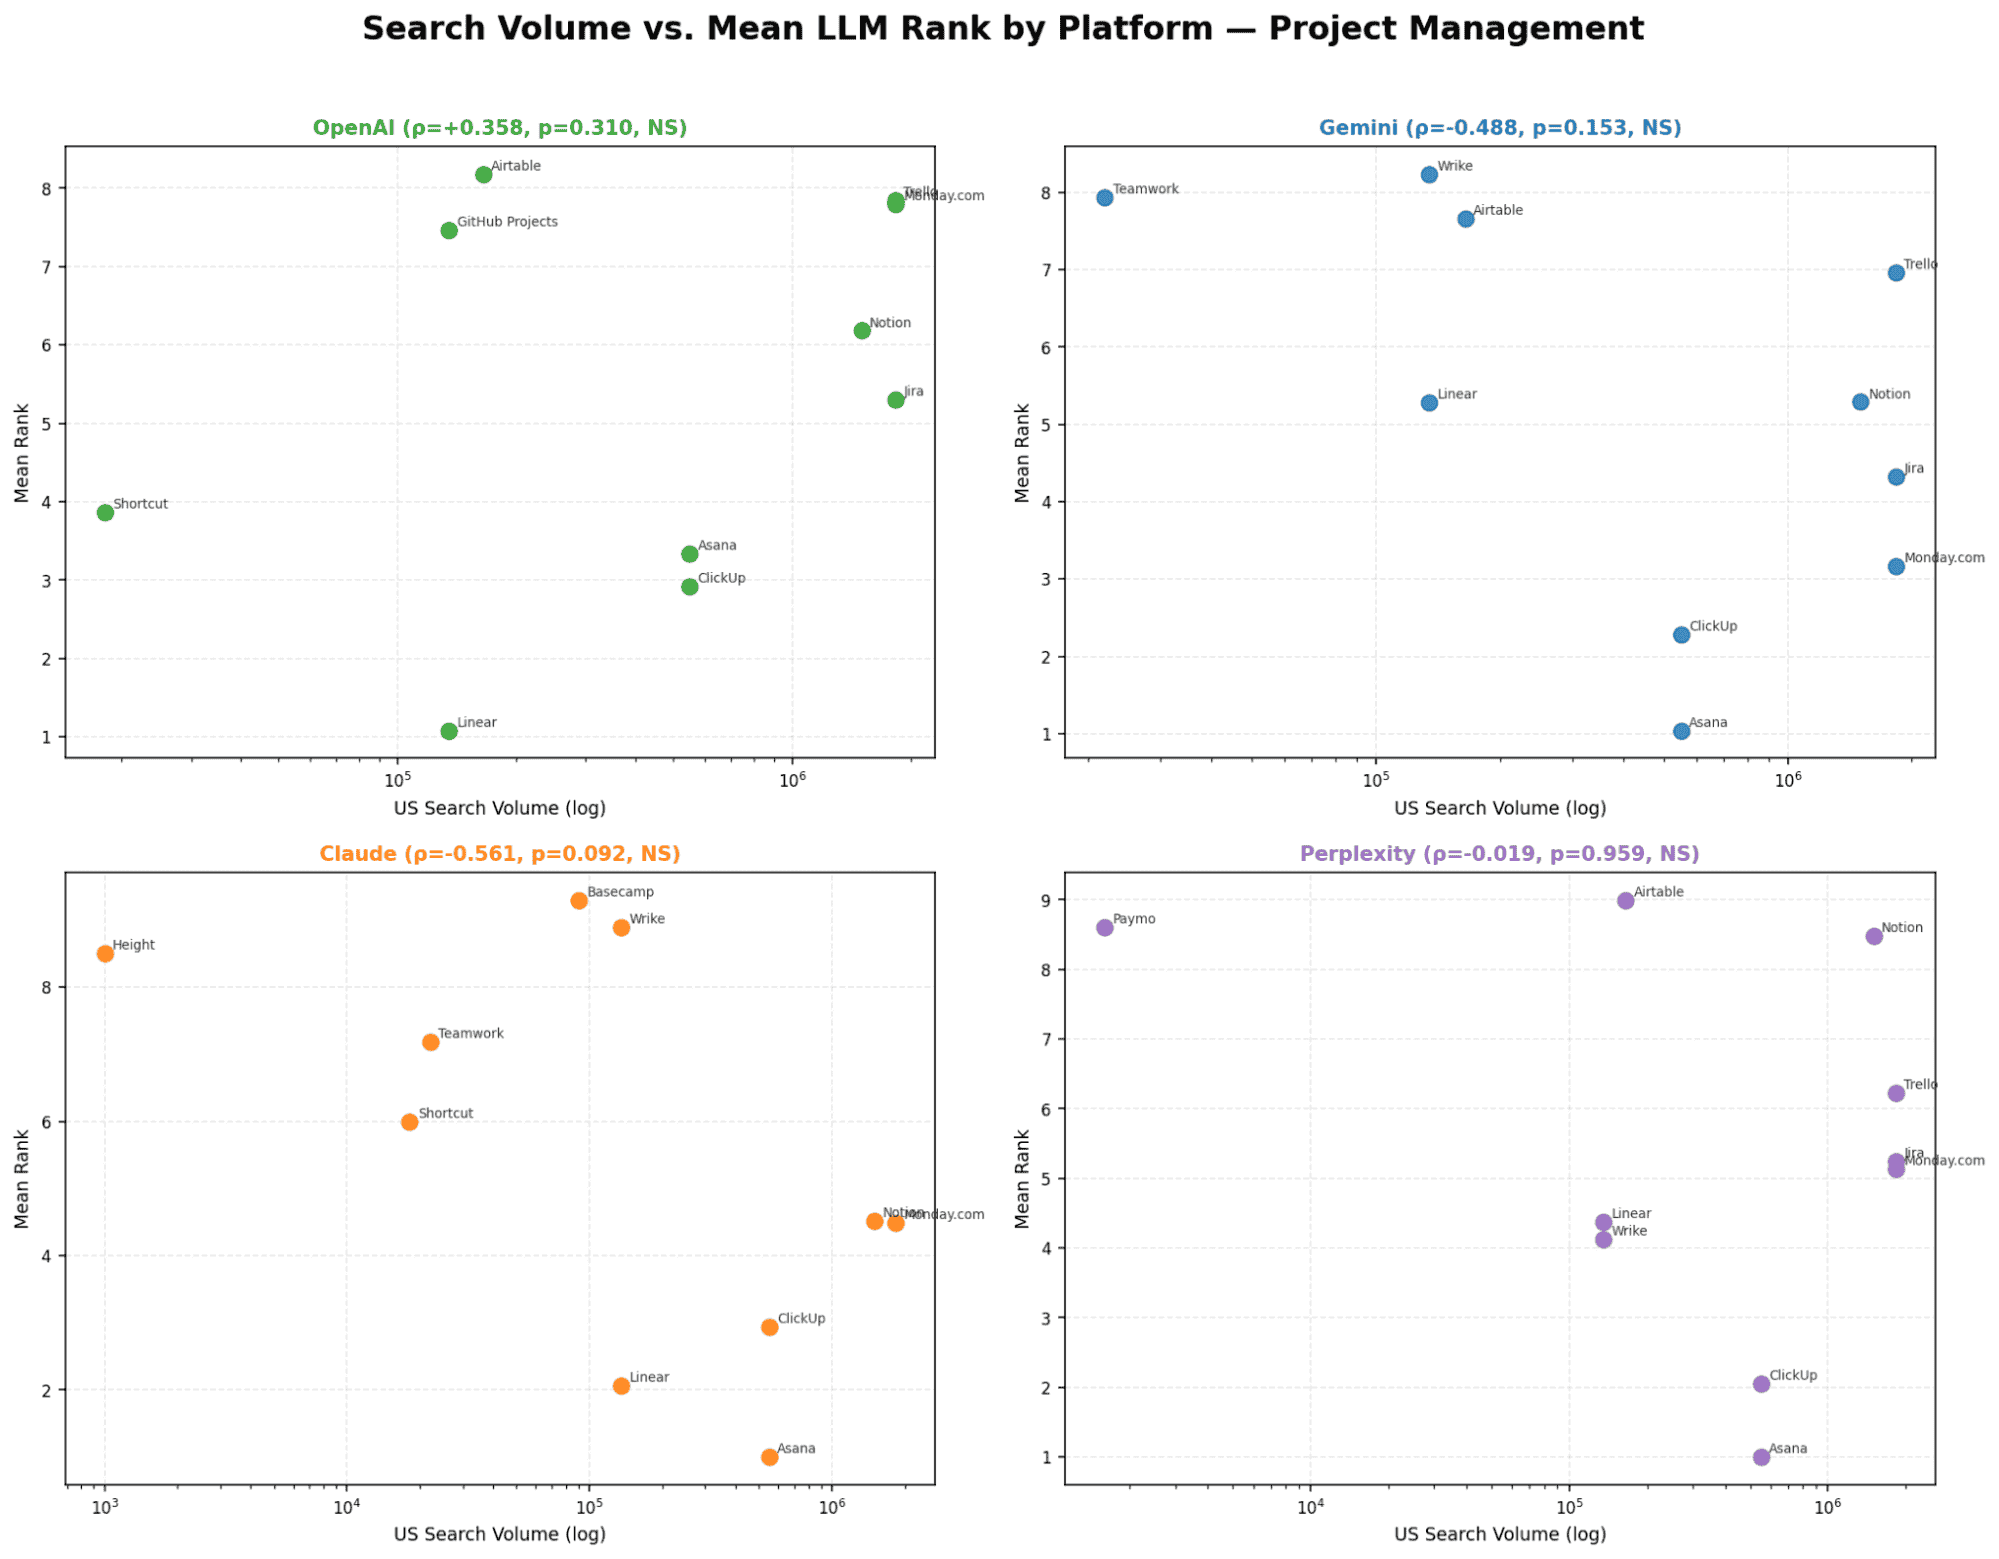
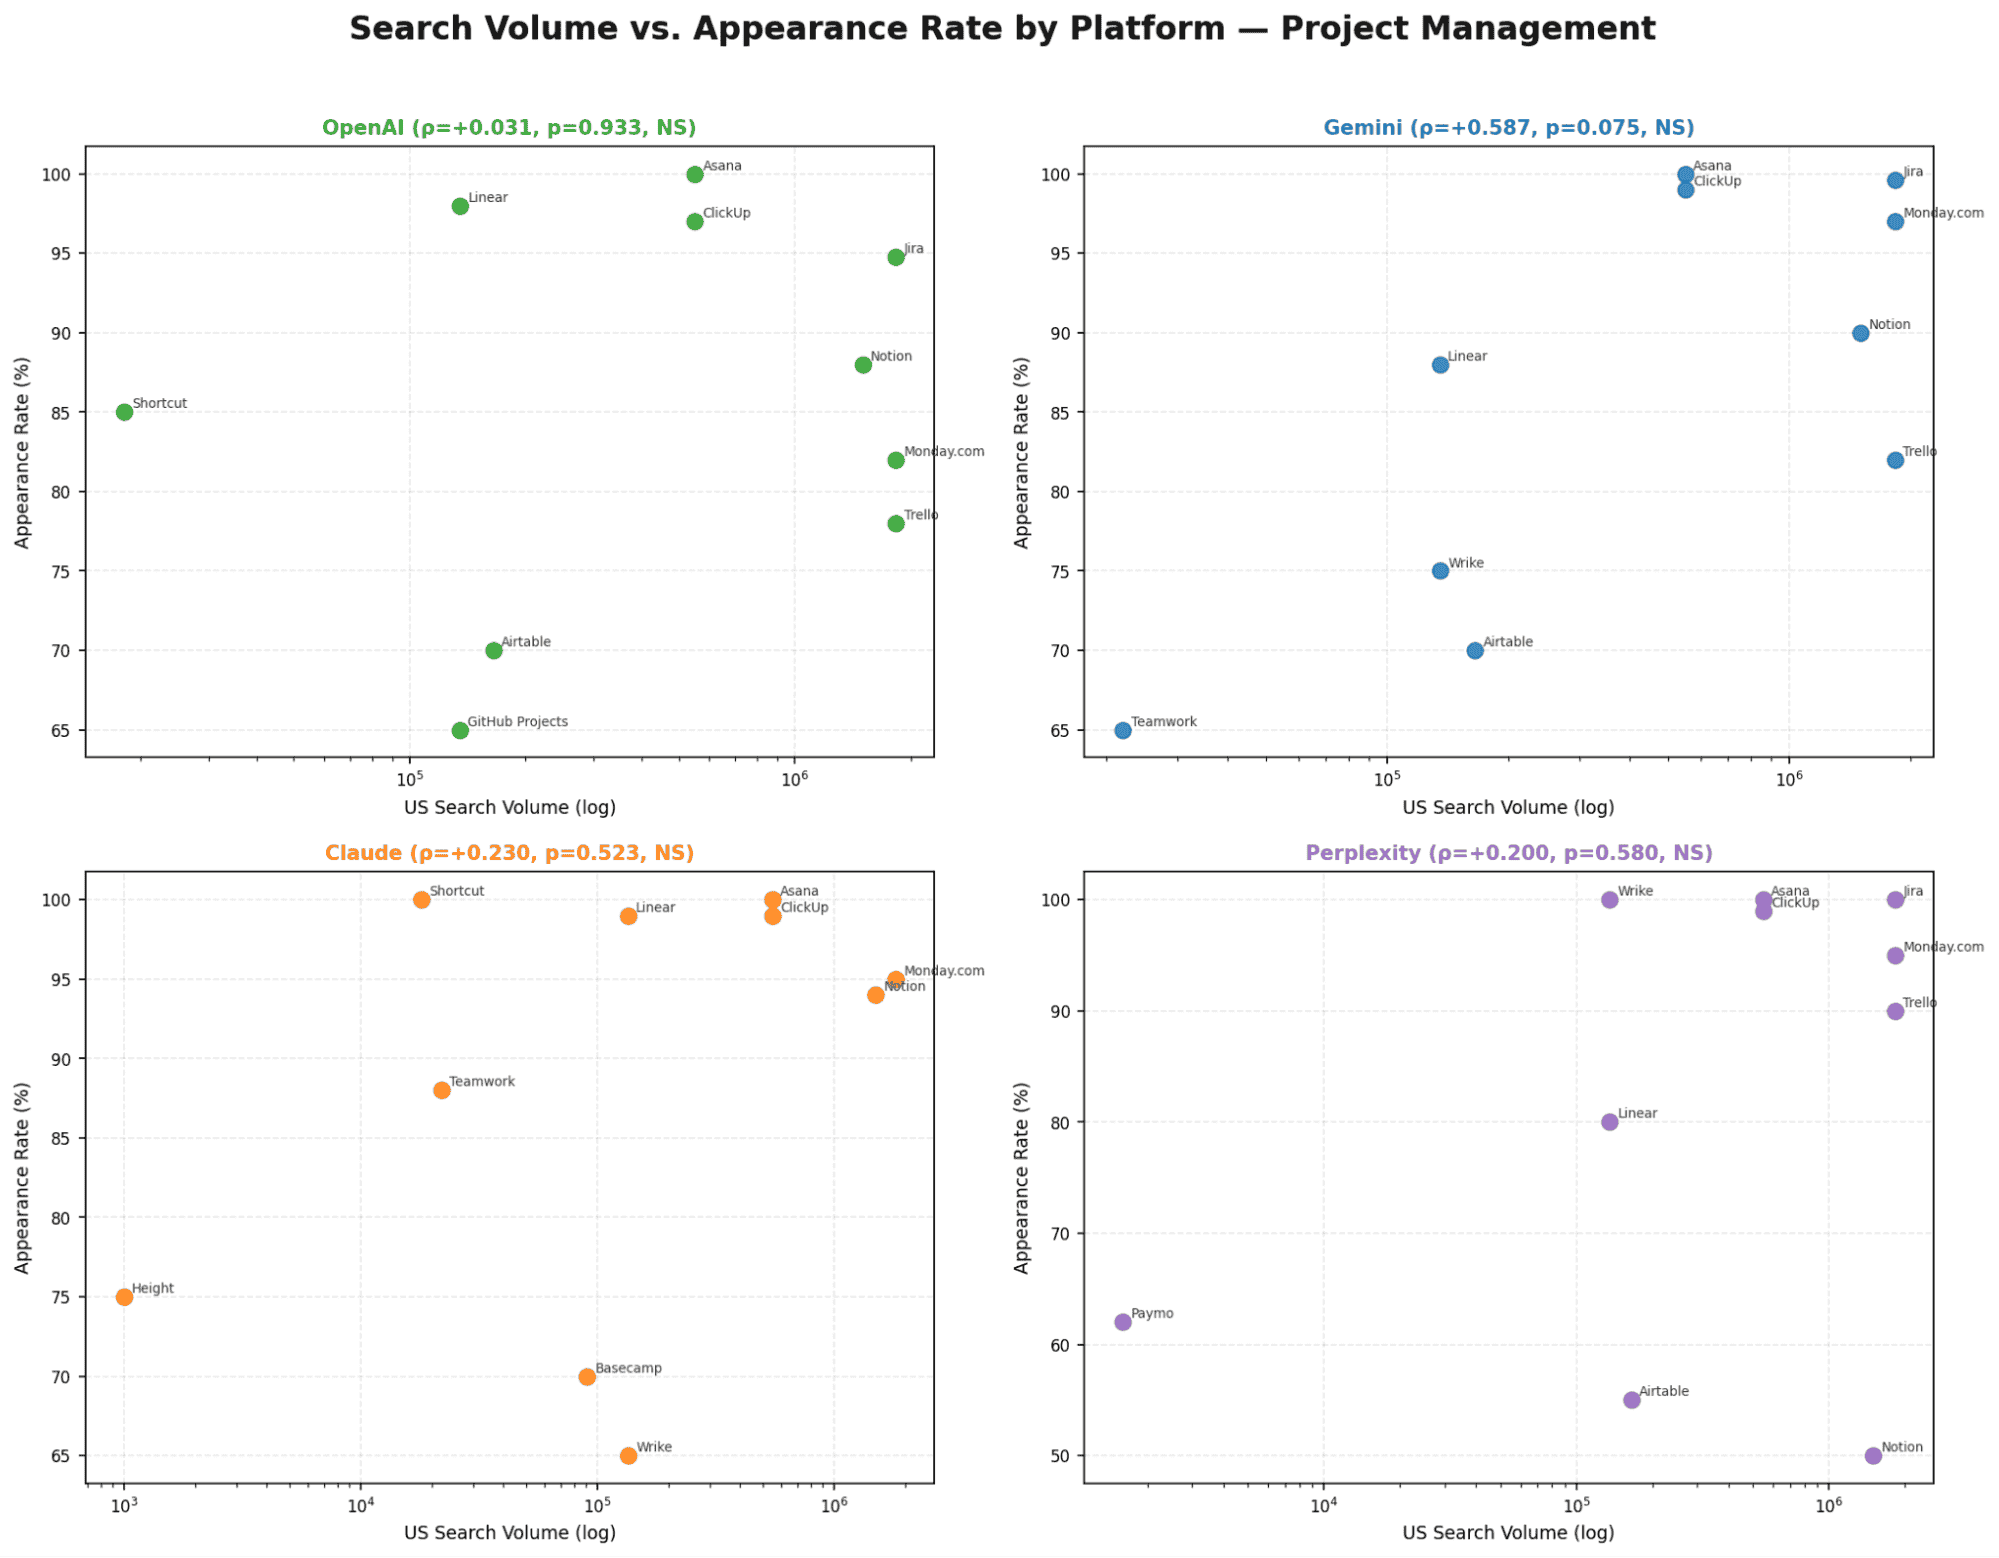
Chart 6 - Search Volume vs. Appearance Rate
Only Perplexity shows a significant SV-to-appearance-rate correlation (ρ=+0.528, p=0.024). All other models show no meaningful relationship between brand size and how often they appear.
Model | Email Marketing | Video Editing | Project Management | Pattern |
|---|---|---|---|---|
OpenAI | Not significant (p > 0.05) | Significant ρ = −0.577, p = 0.004 | Significant p = 0.032 | SV matters for visual/PM; irrelevant for email |
Gemini | Not significant | Significant ρ = −0.424, p = 0.018 | Significant ρ = −0.712, p < 0.001 | Strongest SV sensitivity of all models in PM |
Claude | Not significant | Not significant | Significant ρ = −0.607, p = 0.047 | Internal logic dominates - PM is the lone exception |
Perplexity | Not significant | Not significant | Significant p = 0.039 | Retrieval sources happen to index popular PM brands |
Verdict | No model - SV irrelevant for email | OpenAI + Gemini only | ALL 4 models - only universal category | PM is the only brand-driven category |
Key Signals
Email: Customer.io (1,800 searches/mo) consistently outranks Constant Contact (225,000 searches/mo) by 7+ positions - LLMs appear to prioritise documentation quality over raw brand popularity.
Video: Descript (60,500 SV/mo) outranks CapCut (2.24M SV/mo) on 3 models - product quality and documentation depth > search volume tier
PM: Linear (135K SV, mean rank ~2) consistently outperforms its search volume tier - developer mindshare and technical documentation are the differentiator
Gemini is the most SV-sensitive model overall: strongest ρ in both video (−0.424) and PM (−0.712).
Key Findings
Search volume is a category-dependent signal, not universal
Its influence varies clearly: Email (none) → Video (partial) → Project Management (strong across all models).Category maturity drives whether popularity matters
The more a category has clear market leaders (e.g. Asana, Monday, ClickUp), the more LLMs reflect real-world brand hierarchy.Email marketing shows no correlation with brand popularity
Rankings are driven by documentation quality and content signals, not search demand.Video editing shows partial alignment with search volume
Only OpenAI and Gemini reflect popularity signals, while Claude and Perplexity do not.Project management is fully brand-driven
All models show strong correlation, making search volume a reliable predictor of ranking.Implication: ranking strategy must be category-specific
In PM, high search volume is a structural advantage. In email, that advantage disappears, content authority becomes the only lever.
Strategic Recommendations for AEO
Based on the analysis across 12,000 data points, this report is designed to help you better understand how LLM recommendations behave, and what to expect across different models and categories. The data is empirical and repeatable
Important: The interpretations are not. What we present here is our best attempt to explain the patterns, not a definitive explanation of them.
Strategy | Open AI | Gemini | Claude | Perplexity |
|---|---|---|---|---|
Difficulty to Influence | Moderate | Easiest | Hardest | Moderate |
Key Lever | Content signals + SV (video/PM) | Content diversity & structured data | Training data authority + long-form content | Review site citations (G2, Capterra, PCMag) |
Position Stability | Stable core in email; shuffled tail in video/PM | Almost fully random across all categories | Locked top 3 — hardest to break into | Volatile throughout all categories |
Brand Blindness | Significant for video/PM; none for email | Very High | Medium | Moderate |
SV Influence on Rank | Significant for video/PM; none for email | Zero for email; moderate for video/PM | PM only (p=0.047); none elsewhere | PM only (p=0.039); none elsewhere |
Best Entry Point | Target positions 4–8 via content signals | Widest window — high diversity scores (74–100%) | Requires fundamental authority shift | Focus on review directories + comparison pages |
Recommended Priority | P1 — stable, worth protecting | P0 — easiest gains for new brands | P2 — long-term investment only | P1 — retrieval-based, citation-driven |
For Brands Already Visible in AI Search
Expect stable rankings on Claude and OpenAI. These models show the most locked behaviour across all categories. If you are already in the top 3, your position is unlikely to change frequently and may remain consistent across runs unless the model itself updates.
Expect high volatility on Gemini. Rankings change almost every time, especially in email and video. Your position may fluctuate even if nothing changes on your side. Consistent inclusion matters more than holding a fixed rank.
Expect category-specific visibility. Strong performance in one category does not translate to others. A brand ranking highly in PM may not appear at all in email or video. Each category behaves independently.
Expect Perplexity to be heavily influenced by external sources. Visibility is strongly tied to how often your brand is referenced across the web, especially on review platforms and publisher sites like G2, Capterra, PCMag, and TechRadar. Compared to other models, Perplexity more directly reflects what is already documented and cited online.
Expect search volume to matter more in competitive categories. Correlation between search volume and LLM rankings is not consistent across all categories, but becomes much stronger in more competitive spaces. In our study, PM, the most competitive category, was the only one where all models aligned with search demand, suggesting that brand popularity plays a bigger role as markets mature.
For Brands That Are Invisible in AI Search
Gemini offers the most entry opportunities
It shows the highest diversity across all categories, meaning new or lesser-known brands have a real chance to
appear. Inclusion is more fluid here than on other models.Search volume does not consistently drive visibility
Brand popularity alone is not enough. Inclusion is more influenced by content quality, documentation, and third-party validation signals.Search demand becomes more influential in competitive spaces
The impact of brand popularity increases as categories become more mature and competitive. In those environments, well-known brands are more likely to dominate rankings.Visibility is strongly tied to being mentioned alongside category leaders
Models often surface brands that appear in the same context as established tools. Being part of comparison sets and review ecosystems increases the likelihood of inclusion.Model behaviour varies significantly, there is no single pattern
Each model surfaces a different set of tools and uses different signals. A brand may appear in one model and be completely absent in another.Inclusion comes before ranking
The first milestone is simply appearing in the recommendation set. Only after consistent inclusion does rank position start to matter.
Conclusion
This study analysed 12,000 LLM recommendation queries across three software categories. What the data shows clearly is that LLM recommendations do not follow a single pattern. The underlying behaviour changes depending on the category, the model, and how established the market appears to be.
What is less certain, and more interesting, is why these patterns exist. Based on the data, and combined with our interpretation, a few themes stand out:
Search popularity is not a consistent driver, and likely depends on category dynamics
The data shows that search volume does not uniformly influence LLM rankings.In email marketing, there is no meaningful correlation. Smaller brands consistently outrank much larger ones. In project management, the opposite pattern appears — higher search volume brands tend to rank better across all models. Video editing sits somewhere in between, with mixed behaviour depending on the model.
One possible explanation is category competitiveness. Project management is a more mature and crowded space with clearer market leaders, which may make it easier for LLMs to reflect real-world brand hierarchy. Email, on the other hand, appears more fragmented, which may push models to rely on other signals like content quality or documentation.
This is not something the data directly proves, but it is the most consistent explanation across what we observed.
Each model shows a distinct pattern, likely tied to how it retrieves and ranks information
The differences between models are very clear in the data, but the reasons behind them require interpretation.
• Claude consistently produces stable, repeatable rankings.
• OpenAI appears to maintain a fixed pool of tools, while varying their order.
• Gemini generates highly diverse outputs, often producing completely different lists.
• Perplexity surfaces a noticeably different set of tools, often aligned with review and aggregator sites.
These patterns likely reflect differences in training data, retrieval layers, and ranking logic. For example, Perplexity’s behaviour suggests a stronger reliance on external sources, while Claude appears more “opinionated” or internally consistent.
While we cannot directly observe the internal systems, the consistency of these patterns across all runs suggests that each model operates with its own stable logic.The “locked top positions” pattern suggests a strong positional advantage, but the cause is less clear
Across all models and categories, the top positions behave very differently from the rest. Positions 1–3 are significantly more stable than positions further down the list. In some cases, these positions do not change at all across 1,000 runs. Most variation happens outside this top tier.
What this suggests is a form of “lock-in” at the top. Once a brand reaches these positions, it tends to remain there.
Why this happens is harder to pin down. It could be driven by stronger training signals, clearer consensus in source data, or reinforcement effects where frequently recommended tools continue to appear. Most likely, it is a combination of these factors.
What we can say with confidence is the outcome, the top of the list behaves very differently from the rest, even if the exact mechanism remains uncertain.
Appendix: Methodology Notes
Data Collection
1,000 independent runs per prompt per LLM, no session continuity between runs
All runs conducted in the same calendar period to minimise model update drift
Perplexity citation brackets ([1], [2]) stripped before analysis
Brand name normalisation applied: spelling variants, case differences, and rebranding aliases unified
Limitations
Search volumes are US-based estimates from Ahrefs
LLM outputs can change with model updates; findings reflect the specific model versions active during data collection
Covers three categories - dynamics in other verticals (cybersecurity, fintech, HR tech) may differ