
Usman Akram
Study Parameters
Parameter | Value |
|---|---|
Scope | 134 B2B software categories |
Google keyword per category | Primary 'best [category] software/platform' keyword |
LLM prompt per category | Natural language version of the Google keyword |
Models tested | ChatGPT (GPT-4o), Google Gemini, Anthropic Claude, Perplexity |
LLM data collection | API-automated; one response per model per prompt; brands pulled out in rank order |
Google data collection | Ahrefs API; US region, English; positions 1 to 20 recorded |
Topical authority method | Ahrefs traffic share by domain across the full keyword cluster per category |
Traffic share source | Ahrefs Keyword Explorer: Matching Terms export, bulk re-import, Traffic Share by Domain |
Primary metric | Rank of the topical authority domain in Google vs. its average rank across 4 LLMs |
Secondary metrics | Rank delta (Google vs. LLM avg), mention rate per model, model-level divergence |
Analysis unit | One topical authority domain per category (review aggregators excluded) |
Executive Summary
We wanted to find out one thing: if a brand owns a software category on Google, does it also win in AI search? So we took the domain with the highest Ahrefs traffic share in each of 134 B2B software categories and checked where it ranked on Google versus where four AI models ranked it.
The answer: sometimes, but it's messy.
Only 35.1% of categories lined up cleanly (the AI rank was within 2 spots of Google, and at least 3 models mentioned the brand). Almost exactly the same share, 35.8%, went the other way. In those, the AI models either ranked the topical authority way lower than Google or skipped it completely. The rest, 29.1%, landed somewhere in between. The link between Google rank and average AI rank is weak (Pearson r = 0.145, p = 0.096), and it doesn't clear the bar for statistical significance.
Here's the part that stands out. When AI disagrees with Google, it almost always ranks the topical authority brand lower, not higher. On average it drops 3.65 positions. That tells us AI models lean on how famous a brand is, not how much great content it has published. The biggest jump up belongs to lastpass.com (Google rank 19, average AI rank 5.75). The biggest drop belongs to transcribe.com (Google rank 10, average AI rank 31.5). Same cause in both cases: how well-known the brand is outside its little SEO keyword bubble.
If you're a B2B SaaS brand that poured money into content-led SEO, here's the warning. Owning a Google keyword cluster does not buy you a seat in AI search. The brands AI surfaces with confidence are the ones with broad web presence, press, and a long review history. Not the ones with the highest Ahrefs traffic share.
The Findings at a Glance
Dimension | Finding |
|---|---|
How often topical authority carries over | Only 35.1% of 134 categories line up cleanly between Google and AI. 35.8% diverge. |
Google-to-AI rank link | Pearson r = 0.145 (p = 0.096). Weak and not significant. AI doesn't reliably copy Google. |
Which way the gap runs | Mean delta = +3.65. AI ranks topical authority brands lower than Google, not higher. |
Closest model to Google | Perplexity, mean delta +0.75 and Pearson r = 0.299 (the only model with a real correlation). |
Furthest model from Google | Gemini, mean delta +6.42 and mean rank 10.46. Least connected to Google's authority signals. |
Does traffic share help | A bit. More Ahrefs traffic share modestly tracks with a better AI rank (r = -0.244, p = 0.004). |
Search volume tier twist | Low-volume categories have the worst average delta (+4.62) but the only significant Google-to-AI link (r = 0.487, p = 0.001). High-volume categories show no link at all. |
Biggest jump up (AI boost) | lastpass.com: Google rank 19, average AI rank 5.75 (delta -13.25). Fame beats SEO. |
Biggest drop (AI miss) | transcribe.com: Google rank 10, average AI rank 31.5 (delta +21.5). Niche tool, barely any brand footprint. |
One Thing to Keep in Mind
AI search is highly probabilistic. There's a real element of randomness baked into this channel, and the same prompt can return different answers on different days. We've done our best to strip out as much of that randomness as possible and control the variables we could. But there are still plenty of factors at play, so some of these conclusions won't hold across the board.
Here's the honest version of the thesis: these findings are about software companies specifically, looking at topical authority between Google and AI search. We're not claiming this is the most scientific research ever done on the topic. It's a clear, practical read on a pattern we kept seeing.
Methodology
How we found the topical authority brand
The way we define topical authority here is simple: a company's traffic share within its category. We think traffic share, as a percentage, is a really good proxy for how authoritative a brand is around a given topic cluster. If a brand captures a big slice of all the search traffic for a category's keywords, it has done the most to own that topic in Google's eyes.
Here's how we measured it:
For each category, we took the seed keyword (say, "email marketing"), dropped it into the phrase match report, and exported every keyword that contained that term, usually thousands of them.
We added that whole pool back into Ahrefs in bulk and looked at the traffic share by domain across the entire set.
Then we took the top-ranking software company in that pool and recorded its traffic share
We excluded anything that wasn't a software company itself: Reddit, Quora, review aggregators, and any other non-software sites.
So a brand's traffic share is the percentage of all the category-keyword traffic that one domain captures, measured against everyone else competing for those same terms.
We ran the exact same process across every category and every brand.
How we collected Google ranks
We didn't do this by hand. We pulled the rankings through the Ahrefs API, set to the US region and English. We recorded positions 1 through 20. Anything outside the top 20 got marked 21+. If a domain showed up more than once, we only counted its best position. AI Overviews were noted on the side and never counted as an organic position.
How we collected AI ranks
Through API automation across ChatGPT (GPT-4o), Google Gemini, Anthropic Claude, and Perplexity AI. One response per model per category prompt. We pulled brands in the order they first appeared. "Not mentioned" got recorded as NM. The average AI rank ignores NM values.
One thing worth acknowledging: because we ran these through the API, the results may look a little different from what someone gets searching the same prompt in their own AI window. A real user's results are shaped by their chat history and everything the platform already knows about them, which we don't control for here. That's fine — we're not claiming the API output is the one true answer. It still gives a solid read on visibility and ranking inside AI search.
How we classified consistency
Rating | Definition |
|---|---|
Consistent | Delta of 2 or fewer positions AND mentioned by 3 or more models |
Partial | Delta of 3 to 5 positions OR mentioned by only 2 models |
Divergent | Delta of 6 or more positions OR not mentioned by 2 or more models |
Module 1: Topical Authority vs. Google Rank
The topical authority domain landed in Google's top 3 in 53% of categories, and in the top 10 in 96.3% of them. The median Google rank was position 3. So the Ahrefs traffic share method holds up: the domains it flags as topical leaders really are prominent in organic search.
Only 5 of the 134 domains missed the top 10, and all 5 still made the top 20. Not a single topical authority domain was missing from the first two pages of Google. So the gap this study is chasing isn't between topical authority and Google. It's between Google and AI search.
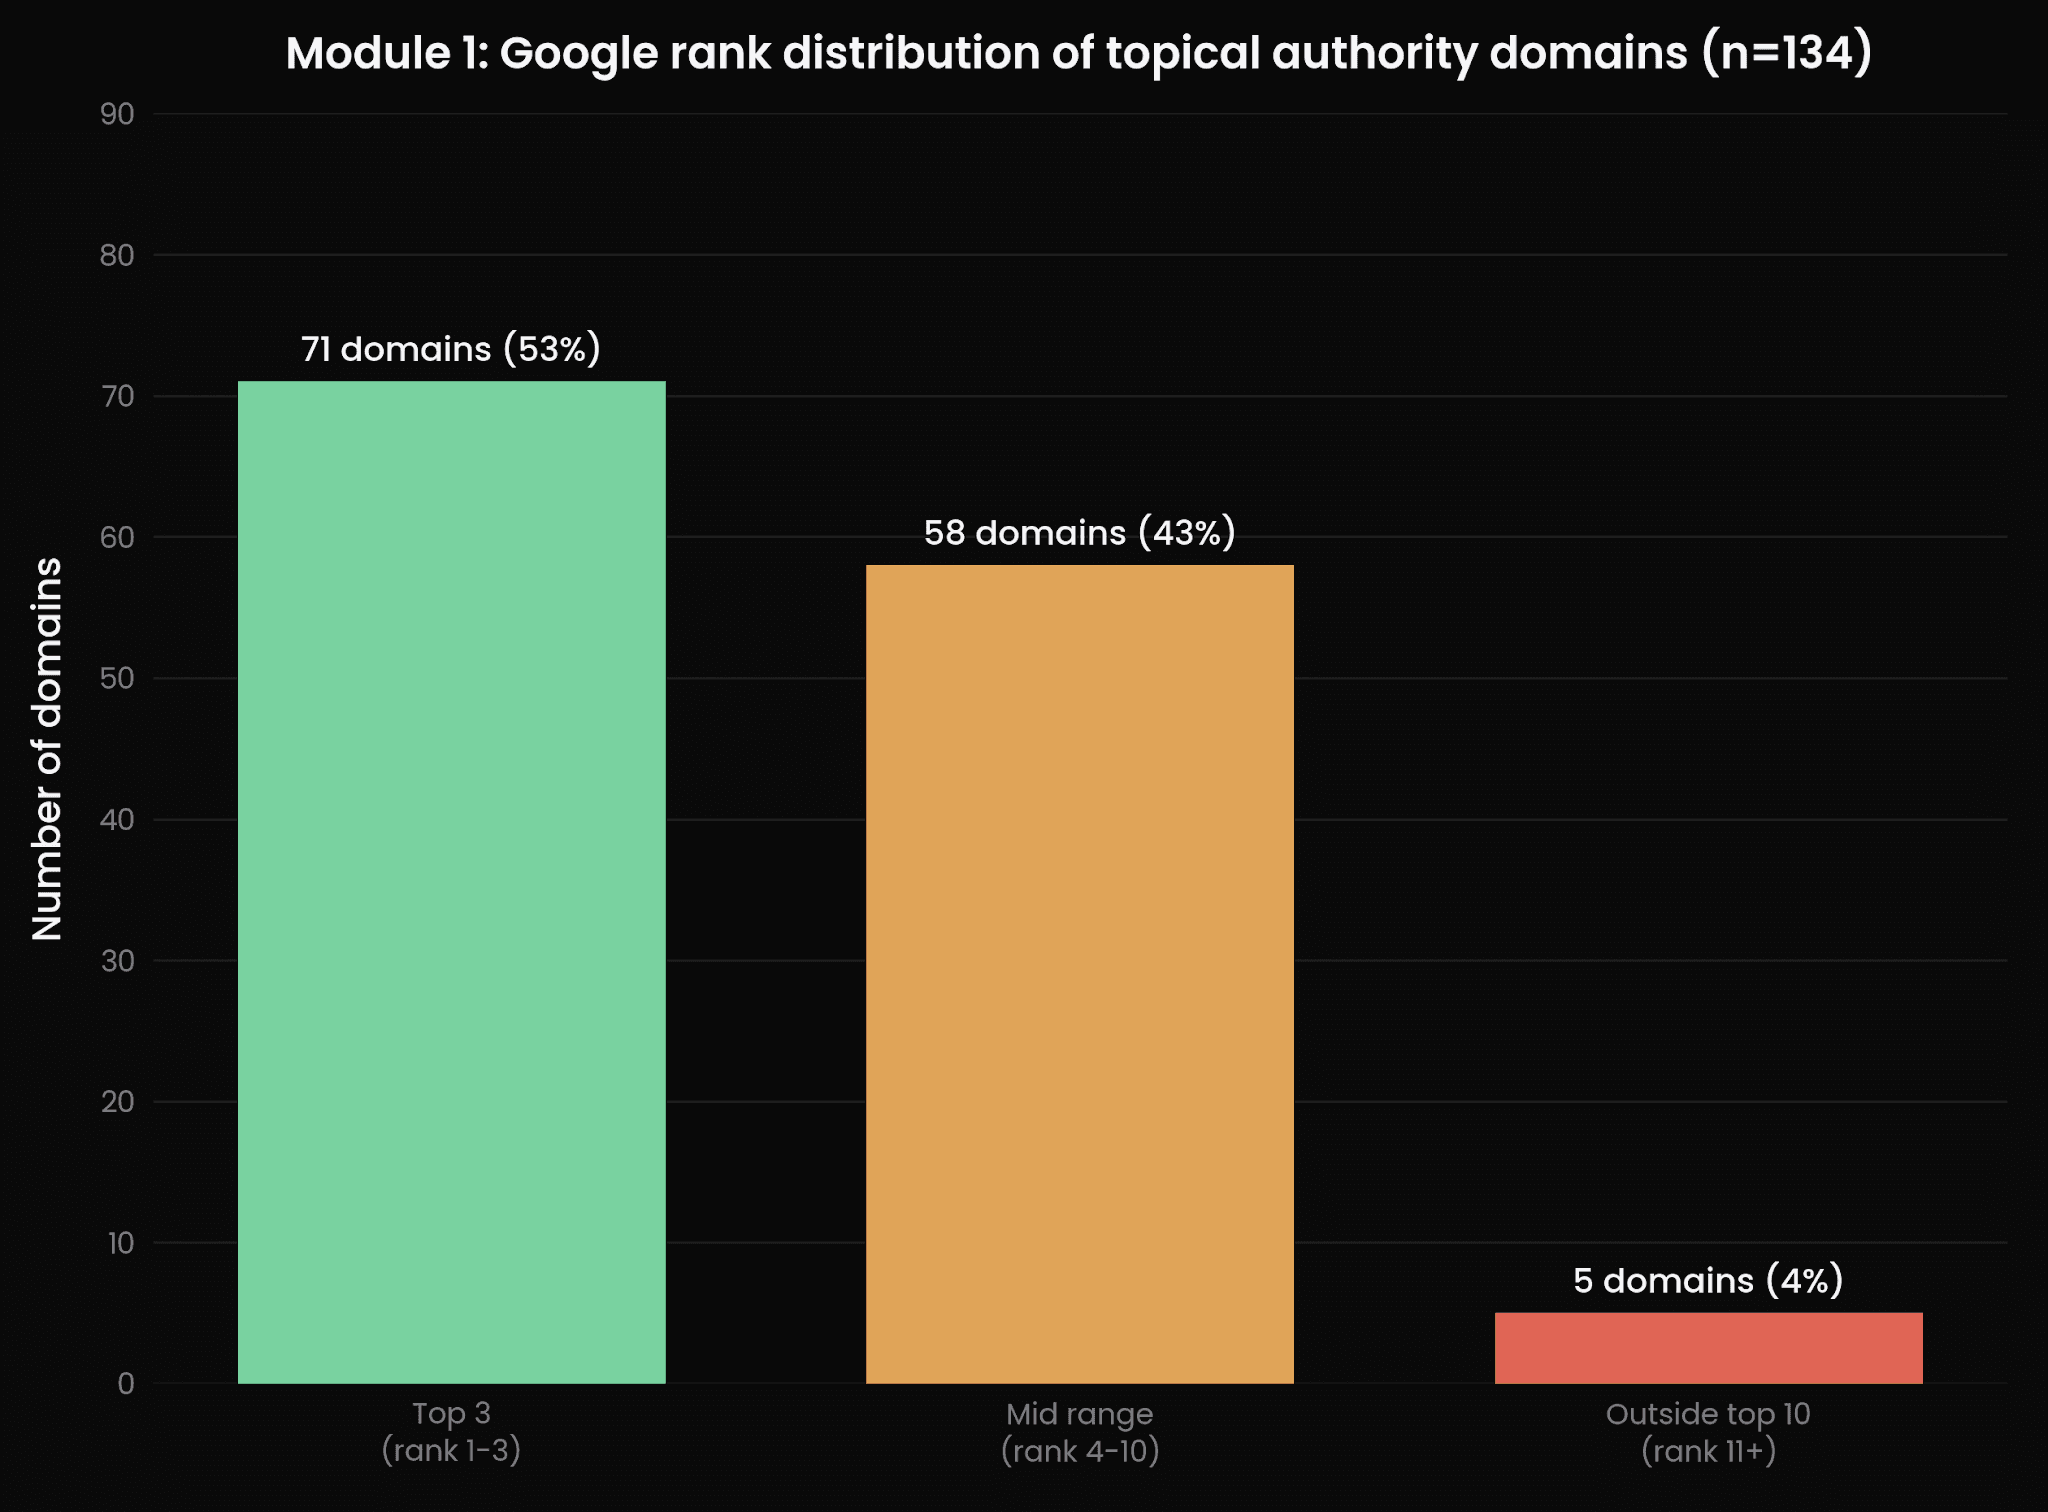
Figure 1: Google rank distribution of topical authority domains across 134 B2B software categories.
What this actually means
Picture the Ahrefs topical authority domain as the brand that has written the most, and the most-read, content about a software category. This module shows Google almost always puts that brand near the top, which is exactly what you'd expect. The real question is whether AI assistants do the same. That's what the rest of the report digs into.
Module 2: Topical Authority vs. LLM Rank
Across the four models, the topical authority domain's average rank slid from Google's baseline of 4.04 down to an average AI rank of 7.69. That's a 3.65-position drop. Claude treated these brands best (mean rank 6.73). Gemini treated them worst (mean rank 10.46). Perplexity stuck closest to Google's order.
The per-model correlation with Google tells the same story from another angle. Only Perplexity has a real, significant link to Google (r = 0.299, p = 0.0004). ChatGPT (r = 0.030) and Gemini (r = 0.056) are basically at zero, which means their rankings are driven by something that has almost nothing to do with topical search authority. Claude sits in the middle (r = 0.154).
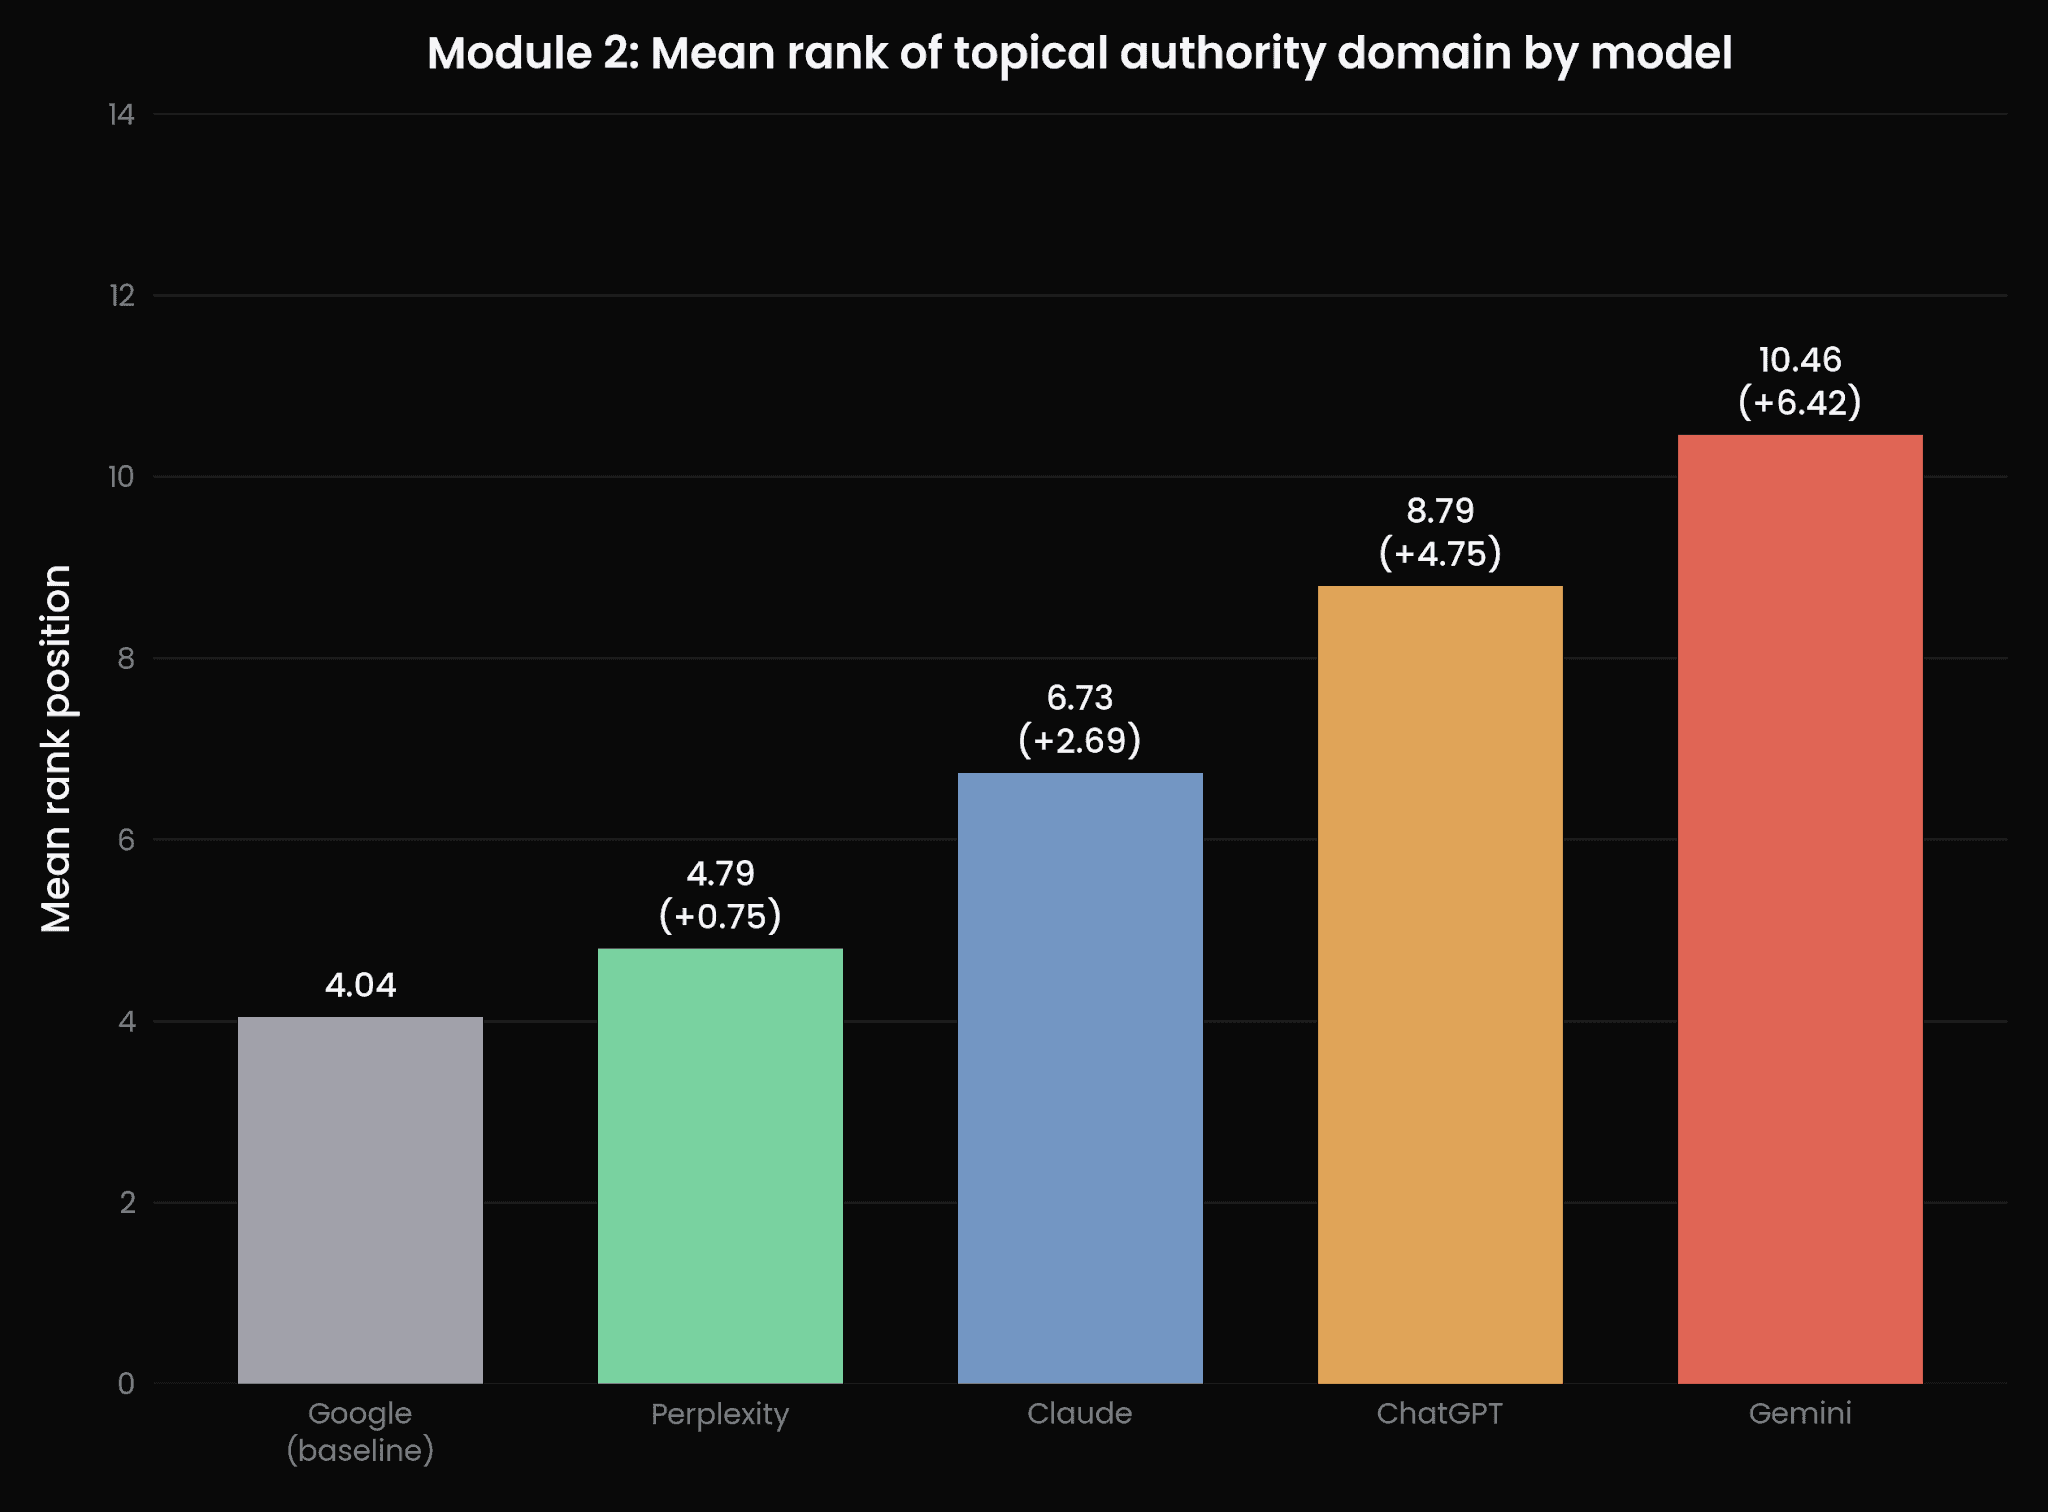
Figure 2: Mean rank of the topical authority domain by model. Delta shown versus the Google baseline.
Model | Mean rank | Mean delta vs. Google | Pearson r vs. Google | Assessment |
|---|---|---|---|---|
Google (baseline) | 4.04 | 0.00 | 1.000 | Reference |
Perplexity | 4.79 | +0.75 | 0.299 (p<0.001) | Most aligned |
Claude | 6.73 | +2.69 | 0.154 (p=0.076) | 2nd most aligned |
ChatGPT | 8.79 | +4.75 | 0.030 (p=0.73) | Moderate divergence |
Gemini | 10.46 | +6.42 | 0.056 (p=0.52) | Most divergent |
What this actually meansSearch Google for 'best CRM software' and the company that has published the most CRM content will probably sit near the top. Ask an AI the same question and you get a different answer, and how different depends a lot on which AI you ask. Perplexity acts the most like Google. Gemini acts the least like it. That matters because if you built your visibility through SEO content, you can't assume that same work carries over to AI search. |
What this actually means
Search Google for 'best CRM software' and the company that has published the most CRM content will probably sit near the top. Ask an AI the same question and you get a different answer, and how different depends a lot on which AI you ask. Perplexity acts the most like Google. Gemini acts the least like it. That matters because if you built your visibility through SEO content, you can't assume that same work carries over to AI search.
Module 3: Google Rank vs. LLM Rank (Correlation)
The scatter plot below puts each domain's Google rank on the x-axis and its average AI rank on the y-axis. The red dashed diagonal is perfect agreement. Points above the line mean AI ranks the domain lower than Google. Points below mean AI ranks it higher.
The cluster of points sitting above the diagonal is the whole story in one picture: for most domains, AI ranks the topical authority lower than Google does. The trend line (amber) tilts up but barely, which confirms the weak correlation (r = 0.145, p = 0.096). The two big exceptions, adobe.com and zoom.com sitting way below the line, come down to one thing: those brands are everywhere in training data. They're among the most-referenced software brands on the internet.
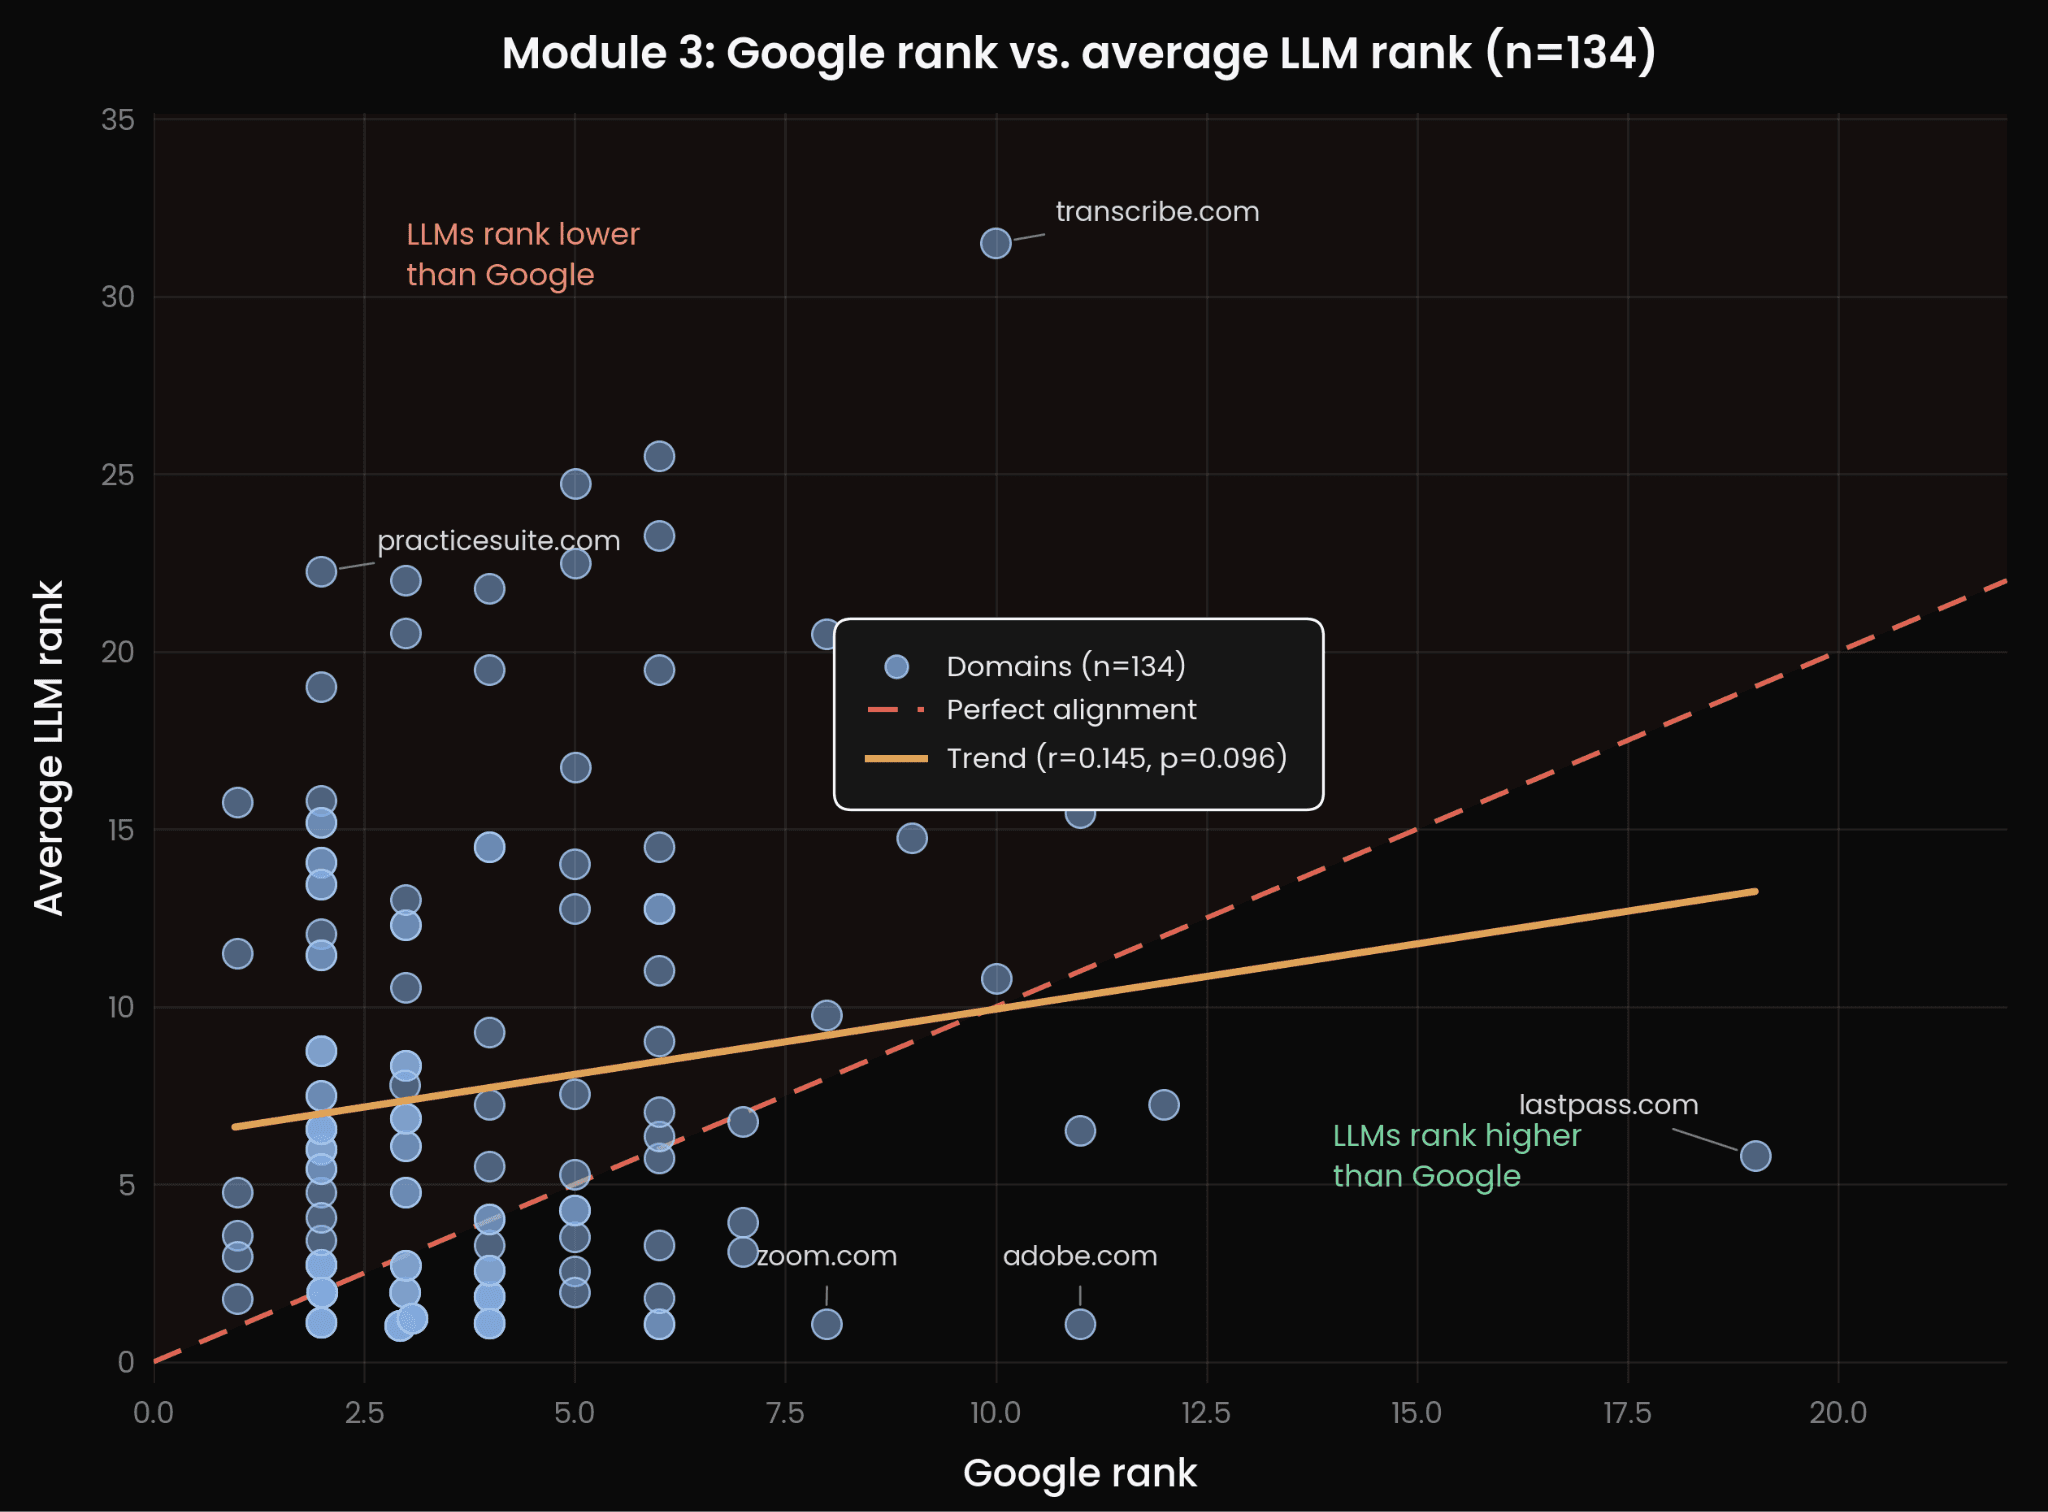
Figure 3: Scatter of Google rank (x) vs. average AI rank (y). Diagonal = perfect alignment. Points above = AI ranks lower. Notable outliers labeled.
What this actually means
This chart is the statistical core of the report. If AI just copied Google, every dot would sit on the red diagonal. The fact that most dots float above it tells you AI is steadily ranking content-authority leaders lower than Google does. And the almost-flat trend line tells you that where a brand sits on Google is a bad predictor of where it shows up in AI answers. The two are measuring different things.
Module 4: Rank Delta Analysis
The chart below shows the full spread of (average AI rank minus Google rank) across all 134 domains. It leans hard to the right, which confirms the typical gap runs one way: AI under-ranks topical authority domains compared to Google, not the other way around.
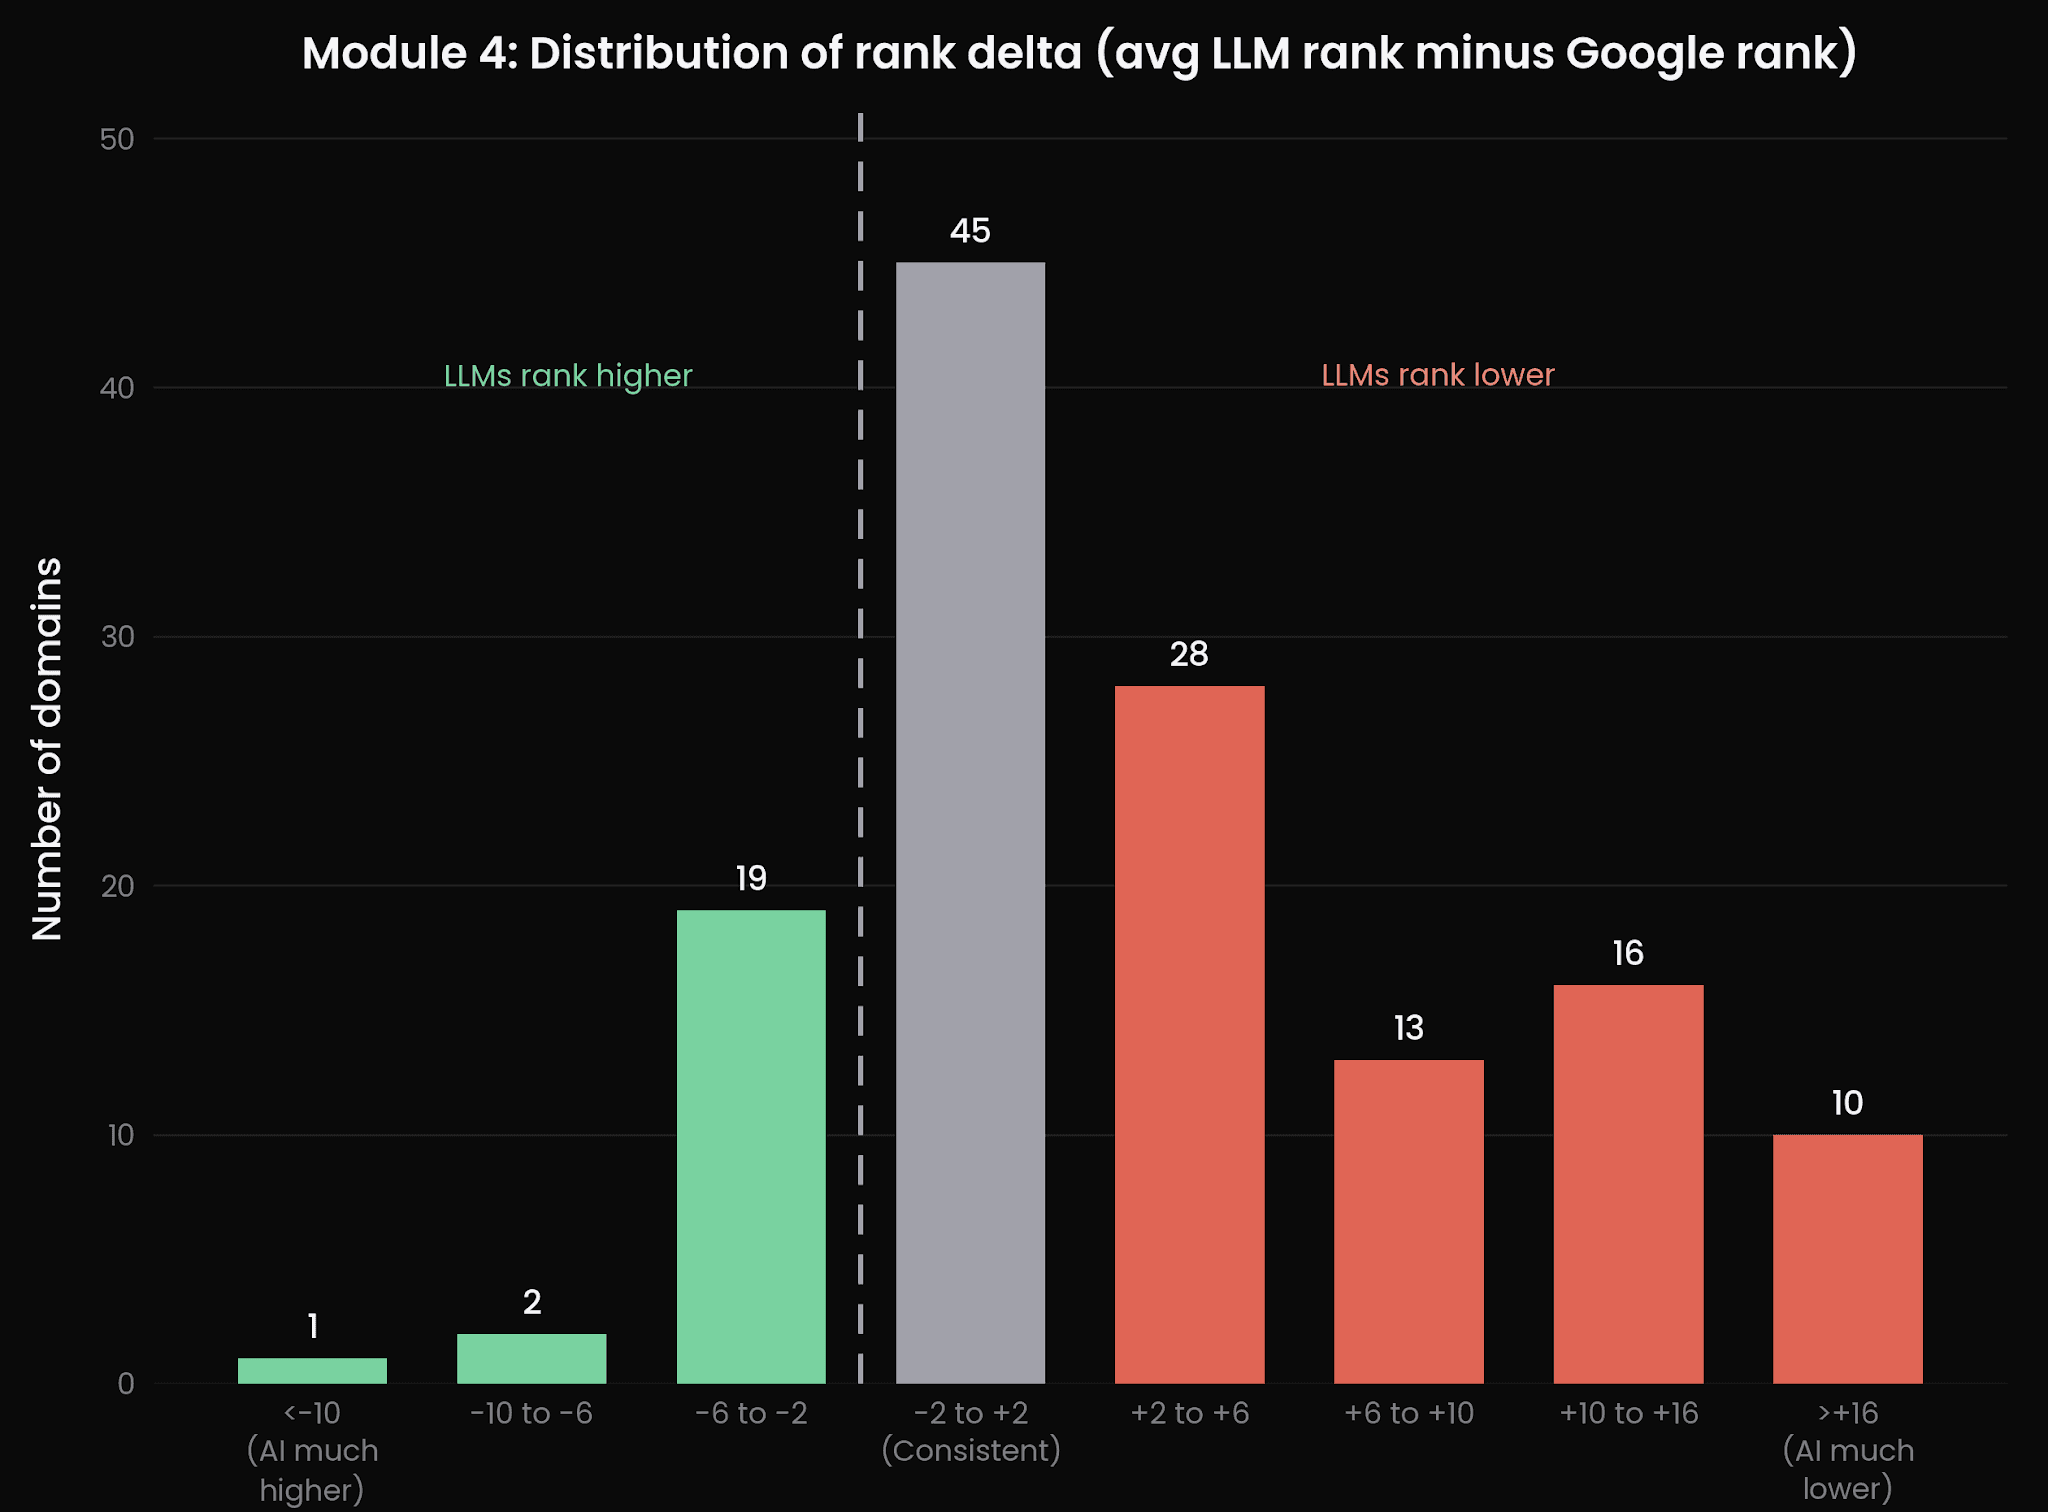
Figure 4: Distribution of rank delta. Green = AI ranks higher than Google. Grey = consistent zone. Red = AI ranks lower.
Domains where AI ranks higher than Google (AI boost, top 10)
Every name on this list is a globally recognizable software brand. These companies show up constantly in pre-training data, product reviews, news, and general web text. AI has learned a strong tie between the brand name and its category, completely separate from where it ranks on Google today. Lastpass is the wildest case: 19th on Google, yet placed in the top 6 by every single model.
Domain | Category | Google rank | Avg LLM rank | Delta |
|---|---|---|---|---|
lastpass.com | Password manager | 19 | 5.75 | -13.25 |
adobe.com | PDF editor | 11 | 1.00 | -10.00 |
zoom.com | Video conferencing | 8 | 1.00 | -7.00 |
checkr.com | Background check | 6 | 1.00 | -5.00 |
greenhouse.com | Applicant tracking | 6 | 1.25 | -4.75 |
docebo.com | Learning management | 12 | 7.25 | -4.75 |
dxo.com | Photo editing | 11 | 6.50 | -4.50 |
zendesk.com | Help desk | 6 | 1.75 | -4.25 |
hubspot.com | Email marketing | 7 | 3.00 | -4.00 |
toonboom.com | Animation | 7 | 3.50 | -3.50 |
Domains where AI ranks lower than Google (AI miss, top 10)
The AI miss list is full of niche SaaS players that built their Google presence by pumping out a high volume of content inside a narrow keyword cluster, not by building broad brand recognition. These domains are SEO-rich but invisible to AI. In several cases, a dominant incumbent (Zoom for VoIP, Salesforce for CRM) swallows the category's traffic leader in AI answers no matter who holds the Ahrefs traffic share spot.
Domain | Category | Google rank | Avg LLM rank | Delta |
|---|---|---|---|---|
transcribe.com | Transcription app | 10 | 31.50 | +21.50 |
practicesuite.com | Medical practice management | 2 | 22.25 | +20.25 |
zonealarm.com | Firewall | 5 | 24.75 | +19.75 |
simvoly.com | Website builder | 6 | 25.50 | +19.50 |
userpilot.com | Customer success | 3 | 22.00 | +19.00 |
wiseagent.com | Real estate CRM | 4 | 21.75 | +17.75 |
openloyalty.io | Loyalty program | 3 | 20.50 | +17.50 |
spotio.com | Field sales | 5 | 22.50 | +17.50 |
cloudtalk.io | VoIP | 6 | 23.25 | +17.25 |
sortly.com | Inventory management | 2 | 19.00 | +17.00 |
There are two key insights here:
The AI miss pattern clusters in niche verticals where the topical authority domain built its Google presence on content volume in a narrow cluster, not broad brand recognition. These domains are SEO-rich but invisible to AI.
The AI boost pattern strongly favors legacy tech brands (Adobe, Zoom, Salesforce, Zendesk, HubSpot, Lastpass) whose names show up constantly in pre-training data, no matter where they sit on Google today.
What this actually means
Think of it this way. Google rewards the brand that wrote the most relevant content. AI rewards the brand it has heard the most about. For famous software companies, those are often two different brands. A small SaaS tool can own a Google keyword cluster with a smart content play, but if it never shows up in tech press, review sites, or user communities, AI doesn't know it exists. Flip it around: a brand like Adobe or Zoom is so baked into the public conversation about software that AI hands it over as the answer whether or not it ranks on page one of Google.
Module 5: Category-Type Patterns (Search Volume Tier Analysis)
We split the 132 categorized domains into three equal tiers of 44 by their Ahrefs USA search volume, straight from the master tracking sheet. Two domains with no SV recorded got dropped from this module.
Tier | SV range | N | Typical categories |
|---|---|---|---|
High SV | 33,000 to 886,000 | 44 | Password manager, SEO software, website builder, translation, graphic design, CRM, accounting |
Mid SV | 4,200 to 33,000 | 44 | Email marketing, inventory management, time tracking, helpdesk, construction management |
Low SV | 100 to 4,200 | 44 | Transcription app, medical practice management, loyalty program, chatbot, farm management |
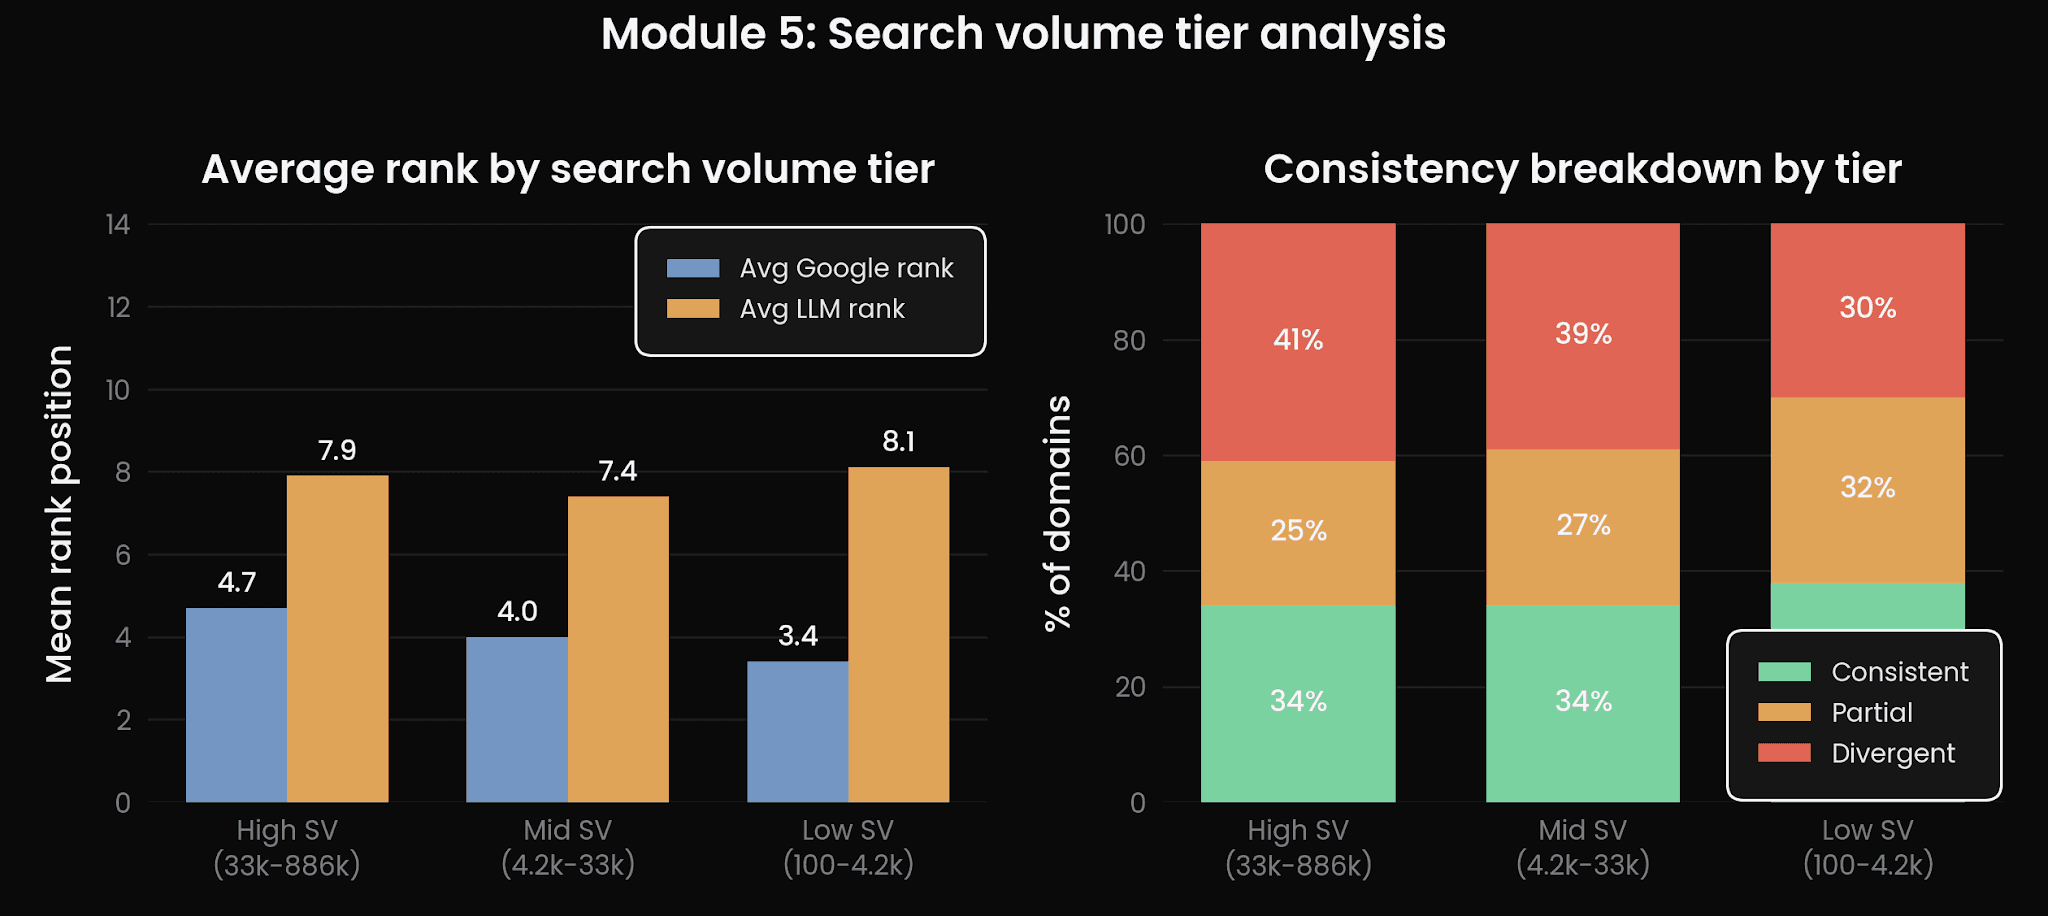
Figure 5: Left, average Google and AI rank by search volume tier. Right, stacked consistency breakdown by tier.
Tier | N | Avg Google rank | Avg LLM rank | Avg delta | Median delta | % Consistent | % Divergent |
|---|---|---|---|---|---|---|---|
High SV (33k-886k) | 44 | 4.70 | 7.88 | +3.17 | +0.75 | 34.1% | 40.9% |
Mid SV (4.2k-33k) | 44 | 4.05 | 7.37 | +3.32 | +1.75 | 34.1% | 38.6% |
Low SV (100-4.2k) | 44 | 3.43 | 8.06 | +4.62 | +3.25 | 38.6% | 29.5% |
Does search volume tier predict AI alignment?
The average delta climbs from High SV (+3.17) to Mid SV (+3.32) to Low SV (+4.62), which makes it look like low-volume niche categories take the biggest AI rank hit. But the average gets yanked around by extreme outliers in every tier. The median tells a cleaner story: High SV sits at just +0.75, Mid SV at +1.75, Low SV at +3.25. The High SV tier splits into two groups: a big cluster of well-aligned, well-known brands and a smaller group of badly divergent content-heavy players. The Low SV tier diverges more evenly and more moderately.
Here's the counterintuitive bit. The Low SV tier actually has the best consistent rate at 38.6%, versus 34.1% for both High and Mid SV. Low SV also has the lowest divergence rate at 29.5% versus 40.9% for High SV. High SV has the worst divergence of the three, driven by cases where a famous incumbent owns the AI answer no matter who holds the Ahrefs traffic share spot.
Traffic share vs. AI rank and Google rank, by tier
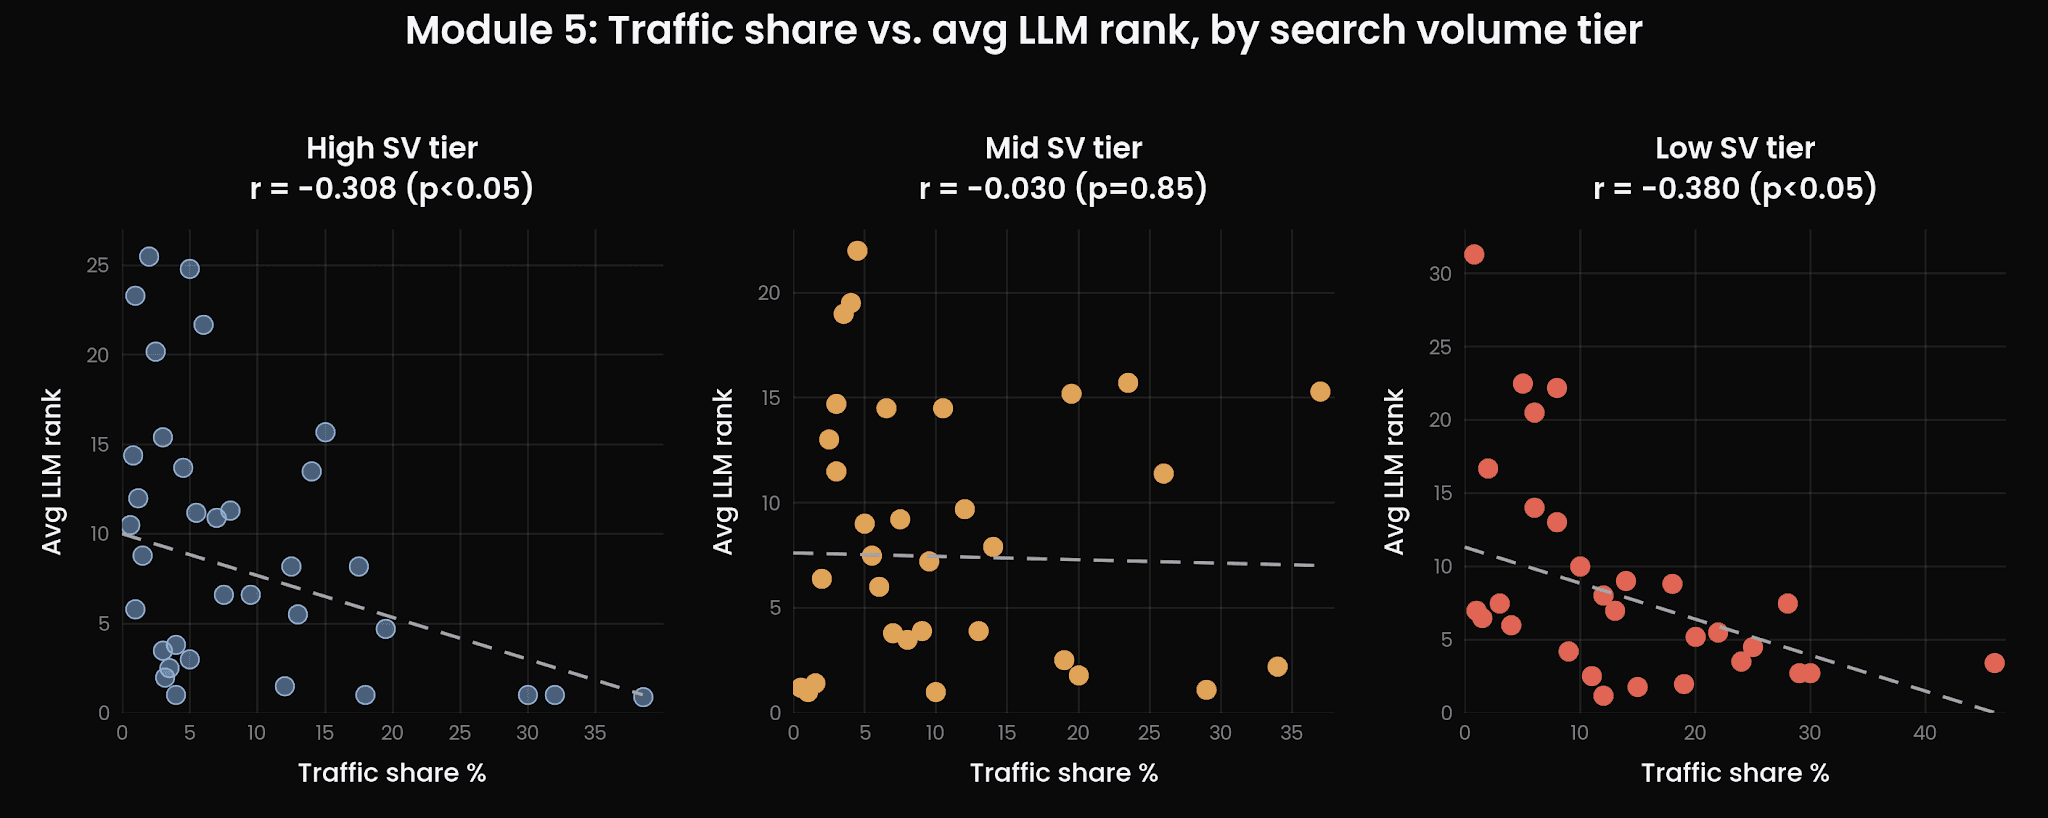
Figure 6: Scatter of traffic share % vs. average AI rank by tier. Negative slope = more traffic share predicts a better AI rank.
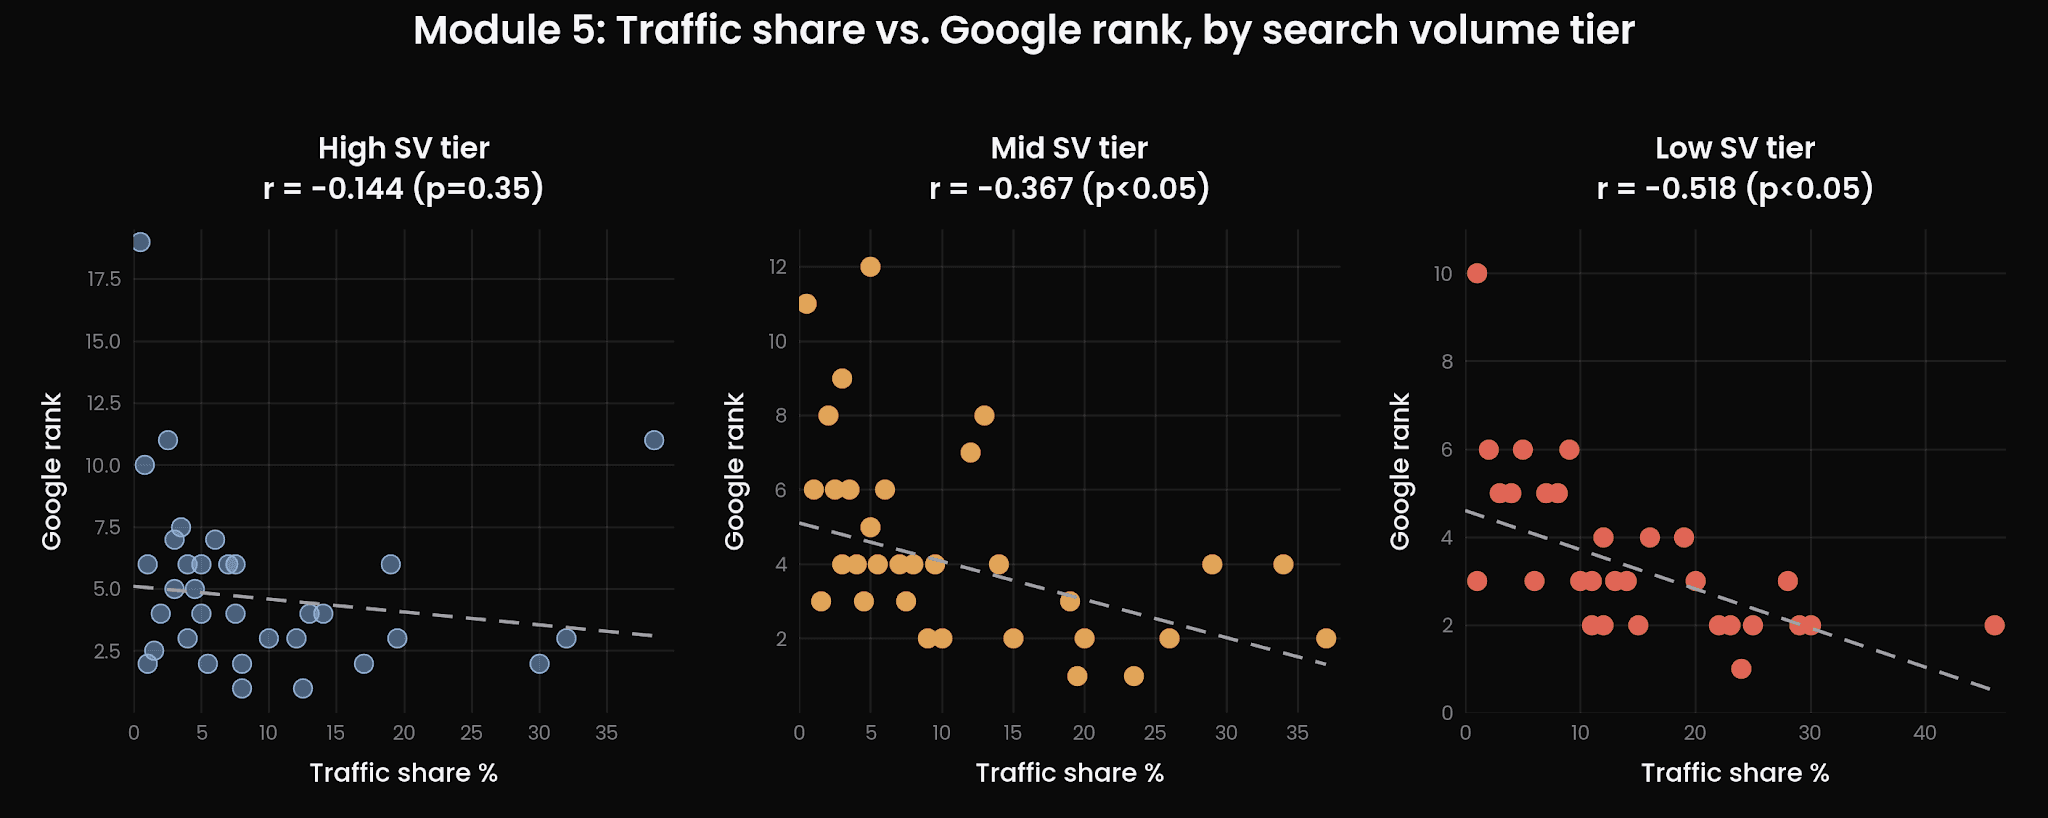
Figure 7: Scatter of traffic share % vs. Google rank by tier. Negative slope = more traffic share predicts a higher Google rank.
Relationship | High SV r | High SV p | Mid SV r | Mid SV p | Low SV r | Low SV p |
|---|---|---|---|---|---|---|
Google rank vs. avg LLM rank | 0.096 | 0.534 | −0.025 | 0.872 | 0.487 | 0.001 |
Traffic share vs. avg LLM rank | −0.308 | 0.042 | −0.030 | 0.849 | −0.380 | 0.011 |
Traffic share vs. Google rank | −0.144 | 0.352 | −0.367 | 0.014 | −0.518 | 0.0003 |
The correlations expose a real structural split across tiers. In Low SV categories, all three relationships are significant: traffic share predicts Google rank (r = -0.518), Google rank predicts AI rank (r = 0.487), and traffic share predicts AI rank (r = -0.380). A clean signal chain exists. In High SV categories, only traffic share to AI rank holds up (r = -0.308), while the Google-to-AI link vanishes completely. In Mid SV categories, only traffic share to Google rank is significant (r = -0.367).
So the thing driving AI visibility changes by category type. In niche, low-volume categories, owning the keyword cluster on Ahrefs pulls Google prominence and AI visibility along together. In high-volume categories, brand familiarity in training data overrides both, and no amount of content gets a lesser-known brand into AI answers.
What this actually means
Simplest way to frame it. In small, specialist software categories, if you own the Google results, there's a decent chance AI recommends you too. The internet doesn't have many competing voices about parking management software or farm tools, so the brand Google trusts is usually the one AI learned about as well. In big, crowded categories like password managers or website builders, that logic falls apart. There are so many well-known names in those spaces that AI defaults to whoever is most famous, not whoever did the best SEO. Owning a keyword cluster is not the same as owning the conversation.
Recommendations
Strategy | Rationale | Priority |
|---|---|---|
Check your AI visibility separately from your Google rank | Pearson r = 0.145 means Google rank is a weak stand-in for AI rank. Run direct prompts across all 4 models for your category keywords every quarter. Don't assume Google performance carries over. | High |
Use Perplexity as your main AI search benchmark | Perplexity is the only model with a significant link to Google rank (r = 0.299). It's the most sensitive to topical authority signals. Moves that lift your Google rank are most likely to show up in Perplexity first. | High |
For niche verticals: invest in brand mentions, not just more content | The AI miss pattern is full of high-content, low-awareness domains. AI learns from citations across the web, not keyword cluster depth. Push third-party reviews, press, and community mentions. | High |
For high-volume categories: accept that SEO authority isn't AI authority | The High SV tier shows no significant Google-to-AI link. In mature, crowded categories, brand familiarity drives AI rank. Content alone won't fix it. Product marketing and earned media are the lever. | High |
Watch Gemini on its own | Gemini diverges most from Google (mean delta +6.42). Even well-known brands can land unexpectedly low. Don't assume steady visibility across every AI platform. Treat each as its own channel. | Medium |
Don't treat topical authority as an AI search guarantee | Even with a top-2 Ahrefs TA rank and a Google top-3 spot, 56% of domains still came out partial or divergent in AI. Topical authority is necessary but not enough for AI visibility. | Ongoing |
Conclusion
Across 134 B2B software categories, topical authority on Google does not reliably carry over to AI search. The weak correlation (r = 0.145), the 35.8% divergence rate, and the average rank drop of +3.65 positions all point the same way: AI isn't simply mirroring the topical depth signals behind Google rankings. It leans on broader brand familiarity instead, the kind that comes from being referenced widely across the internet, not from owning a single keyword cluster.
The study also shows the mechanism changes by category type. In niche, low-volume verticals, there's a clean signal chain from traffic share to Google rank to AI rank, but the absolute AI positions are the worst because niche tools have barely any training data footprint. In high-volume, mature categories, brand ubiquity in training data overrides every search signal, and the Google-to-AI link disappears entirely. Both create their own problems for B2B SaaS brands.
The data shows clear correlations between traffic share, Google rank, and AI visibility, but it can't prove cause. Other factors, including brand age, domain authority, PR spend, and product review volume, almost certainly explain a big chunk of the variance. As AI search keeps growing as a discovery channel for software buyers, the gap between traditional SEO authority and AI visibility is going to become a bigger strategic fault line. The brands that win will be the ones that build both: topical depth for Google, and broad web presence for AI.
Appendix: Full Data Table (134 Domains, Sorted by Delta)
Sorted by rank delta, largest positive first. Positive delta = AI ranks lower than Google. Negative delta = AI ranks higher.
Domain | Category | Google rank | Avg LLM rank | Delta | Consistency |
|---|---|---|---|---|---|
transcribe.com | Transcription app | 10 | 31.50 | +21.50 | Divergent |
practicesuite.com | Medical practice mgmt | 2 | 22.25 | +20.25 | Divergent |
zonealarm.com | Firewall | 5 | 24.75 | +19.75 | Divergent |
simvoly.com | Website builder | 6 | 25.50 | +19.50 | Divergent |
userpilot.com | Customer success | 3 | 22.00 | +19.00 | Divergent |
wiseagent.com | Real estate CRM | 4 | 21.75 | +17.75 | Divergent |
spotio.com | Field sales | 5 | 22.50 | +17.50 | Divergent |
openloyalty.io | Loyalty program | 3 | 20.50 | +17.50 | Divergent |
cloudtalk.io | VoIP | 6 | 23.25 | +17.25 | Divergent |
sortly.com | Inventory management | 2 | 19.00 | +17.00 | Divergent |
lanschool.com | Classroom management | 4 | 19.50 | +15.50 | Divergent |
chirofusionsoftware.com | Chiropractic | 1 | 15.75 | +14.75 | Divergent |
rewardful.com | Affiliate marketing | 2 | 15.75 | +13.75 | Divergent |
parkable.com | Parking management | 6 | 19.50 | +13.50 | Divergent |
thinkwave.com | Gradebook | 2 | 15.25 | +13.25 | Divergent |
practicesuite.com | Medical billing | 2 | 15.25 | +13.25 | Divergent |
chatbot.com | Chatbot | 8 | 20.25 | +12.25 | Divergent |
excire.com | Photo management | 2 | 14.00 | +12.00 | Divergent |
adobe.com | Document management | 5 | 16.75 | +11.75 | Divergent |
planetdds.com | Dental | 2 | 13.75 | +11.75 | Divergent |
bill.com | Accounts receivable | 2 | 13.50 | +11.50 | Divergent |
mediavalet.com | Digital asset mgmt | 4 | 14.50 | +10.50 | Divergent |
snipeitapp.com | IT asset management | 4 | 14.50 | +10.50 | Divergent |
crowdin.com | Translation | 1 | 11.50 | +10.50 | Divergent |
guidecx.com | Customer onboarding | 3 | 13.00 | +10.00 | Divergent |
idrive.com | Cloud storage | 2 | 12.00 | +10.00 | Divergent |
juro.com | Contract management | 3 | 12.50 | +9.50 | Divergent |
fieldwire.com | Construction mgmt | 2 | 11.50 | +9.50 | Divergent |
salesforce.com | Lead generation | 2 | 11.50 | +9.50 | Divergent |
serato.com | Beat making | 5 | 14.00 | +9.00 | Divergent |
alitu.com | Podcast | 6 | 14.50 | +8.50 | Divergent |
ironscales.com | Email security | 5 | 12.75 | +7.75 | Divergent |
farmbrite.com | Agriculture | 3 | 10.50 | +7.50 | Divergent |
photoroom.com | Background removal | 6 | 12.75 | +6.75 | Divergent |
buildertrend.com | Construction | 2 | 8.75 | +6.75 | Divergent |
farmbrite.com | Farm management | 2 | 8.75 | +6.75 | Divergent |
getaccept.com | Proposal | 2 | 8.75 | +6.75 | Divergent |
zoho.com | Recruitment | 6 | 12.75 | +6.75 | Divergent |
shipbob.com | 3PL | 9 | 14.75 | +5.75 | Divergent |
payhoa.com | HOA management | 2 | 7.50 | +5.50 | Divergent |
goodbudget.com | Budgeting | 2 | 7.25 | +5.25 | Divergent |
complyadvantage.com | AML | 3 | 8.25 | +5.25 | Divergent |
ganttpro.com | Gantt chart | 3 | 8.25 | +5.25 | Divergent |
compliancequest.com | Quality management | 4 | 9.25 | +5.25 | Divergent |
waveapps.com | Accounting | 6 | 11.00 | +5.00 | Partial |
solarwinds.com | Server monitoring | 3 | 8.00 | +5.00 | Partial |
yourmembership.com | Association mgmt | 2 | 6.25 | +4.25 | Partial |
cognism.com | Sales intelligence | 3 | 7.25 | +4.25 | Partial |
smartlook.com | Heatmap | 2 | 6.25 | +4.25 | Partial |
reedsy.com | Writing | 11 | 15.50 | +4.50 | Partial |
gradelink.com | School management | 2 | 6.50 | +4.50 | Partial |
domo.com | Reporting | 2 | 6.50 | +4.50 | Partial |
taxicaller.com | Taxi dispatch | 2 | 5.75 | +3.75 | Partial |
riskonnect.com | Risk management | 3 | 6.75 | +3.75 | Partial |
cointracker.io | Crypto tax | 1 | 4.75 | +3.75 | Partial |
semarchy.com | Master data mgmt | 3 | 6.75 | +3.75 | Partial |
brex.com | Spend management | 4 | 7.25 | +3.25 | Partial |
salesforce.com | Partner management | 3 | 6.25 | +3.25 | Partial |
pushpress.com | Gym management | 2 | 5.50 | +3.50 | Partial |
hotelogix.com | Hotel management | 3 | 6.00 | +3.00 | Partial |
avg.com | Antivirus | 6 | 9.00 | +3.00 | Partial |
churchtrac.com | Church management | 5 | 7.50 | +2.50 | Partial |
almabase.com | Alumni management | 1 | 3.50 | +2.50 | Partial |
squareup.com | Graphic design | 2 | 4.75 | +2.75 | Partial |
whova.com | Event management | 2 | 4.00 | +2.00 | Consistent |
lokalise.com | Localisation | 1 | 3.00 | +2.00 | Consistent |
plytix.com | PIM | 8 | 9.75 | +1.75 | Consistent |
sentinelone.com | Endpoint security | 3 | 4.75 | +1.75 | Consistent |
delighted.com | NPS | 3 | 4.75 | +1.75 | Consistent |
workiva.com | ESG | 4 | 5.50 | +1.50 | Consistent |
betterimpact.com | Volunteer management | 2 | 3.50 | +1.50 | Consistent |
bloomerang.com | Nonprofit | 2 | 3.00 | +1.00 | Consistent |
logicmonitor.com | Network monitoring | 6 | 7.00 | +1.00 | Consistent |
spendesk.com | ERP | 10 | 10.75 | +0.75 | Consistent |
pioneerrx.com | Pharmacy | 1 | 1.75 | +0.75 | Consistent |
route4me.com | Route planning | 2 | 2.75 | +0.75 | Consistent |
freetaxusa.com | Tax | 4 | 4.00 | 0.00 | Consistent |
yodeck.com | Digital signage | 2 | 2.00 | 0.00 | Consistent |
expensify.com | Expense management | 2 | 2.50 | +0.50 | Consistent |
donorperfect.com | Donor management | 2 | 2.50 | +0.50 | Consistent |
emclient.com | Email client | 6 | 6.25 | +0.25 | Consistent |
truecoach.co | Personal training | 2 | 2.25 | +0.25 | Consistent |
strapi.io | Headless CMS | 2 | 2.25 | +0.25 | Consistent |
boardable.com | Board management | 5 | 5.25 | +0.25 | Consistent |
hubspot.com | Lead management | 2 | 1.75 | -0.25 | Consistent |
nordlayer.com | VPN for business | 2 | 1.75 | -0.25 | Consistent |
recurly.com | Subscription mgmt | 3 | 2.75 | -0.25 | Consistent |
wrike.com | Project management | 7 | 6.75 | -0.25 | Consistent |
pimcore.com | Catalog management | 6 | 5.75 | -0.25 | Consistent |
adp.com | Benefits administration | 3 | 2.50 | -0.50 | Consistent |
streamlabs.com | Live streaming | 3 | 2.50 | -0.50 | Consistent |
hootsuite.com | Social media mgmt | 2 | 1.25 | -0.75 | Consistent |
evernote.com | Note taking | 4 | 3.25 | -0.75 | Consistent |
workforce.com | Payroll management | 3 | 2.25 | -0.75 | Consistent |
kicad.org | PCB design | 5 | 4.25 | -0.75 | Consistent |
tipalti.com | Accounts payable | 3 | 2.00 | -1.00 | Consistent |
salesforce.com | Sales | 2 | 1.00 | -1.00 | Consistent |
adobe.com | Logo design | 2 | 1.00 | -1.00 | Consistent |
calendly.com | Appointment scheduling | 2 | 1.00 | -1.00 | Consistent |
datadoghq.com | APM | 3 | 2.00 | -1.00 | Consistent |
dokuwiki.org | Wiki | 5 | 4.00 | -1.00 | Consistent |
coinstats.app | Crypto portfolio | 4 | 2.75 | -1.25 | Consistent |
cleverfiles.com | Data recovery | 4 | 2.50 | -1.50 | Consistent |
xmind.com | Mind mapping | 3 | 1.50 | -1.50 | Consistent |
forcepoint.com | DLP | 5 | 3.50 | -1.50 | Consistent |
reputation.com | Reputation mgmt | 4 | 2.25 | -1.75 | Consistent |
sap.com | Supply chain mgmt | 3 | 1.00 | -2.00 | Consistent |
gusto.com | Payroll | 3 | 1.00 | -2.00 | Consistent |
vimeo.com | Video hosting | 4 | 2.00 | -2.00 | Consistent |
adobe.com | Graphic design | 3 | 1.00 | -2.00 | Consistent |
appfolio.com | Property management | 3 | 1.00 | -2.00 | Consistent |
semrush.com | SEO | 4 | 1.75 | -2.25 | Partial |
acronis.com | Backup | 4 | 1.75 | -2.25 | Partial |
bitwarden.com | Password management | 5 | 2.50 | -2.50 | Partial |
planswift.com | Takeoff | 4 | 1.50 | -2.50 | Partial |
revolutionehr.com | Optometry | 4 | 1.25 | -2.75 | Partial |
zenoti.com | Spa | 6 | 3.25 | -2.75 | Partial |
salesforce.com | CRM | 4 | 1.00 | -3.00 | Partial |
clio.com | Case management | 4 | 1.00 | -3.00 | Partial |
bamboohr.com | Performance mgmt | 7 | 4.00 | -3.00 | Partial |
salesforce.com | CPQ | 4 | 1.00 | -3.00 | Partial |
microsoft.com | Team collaboration | 5 | 2.00 | -3.00 | Partial |
webpt.com | Physical therapy | 4 | 1.00 | -3.00 | Partial |
toonboom.com | Animation | 7 | 3.50 | -3.50 | Partial |
hubspot.com | Email marketing | 7 | 3.00 | -4.00 | Partial |
zendesk.com | Help desk | 6 | 1.75 | -4.25 | Partial |
dxo.com | Photo editing | 11 | 6.50 | -4.50 | Partial |
greenhouse.com | Applicant tracking | 6 | 1.25 | -4.75 | Partial |
docebo.com | Learning management | 12 | 7.25 | -4.75 | Partial |
checkr.com | Background check | 6 | 1.00 | -5.00 | Partial |
zoom.com | Video conferencing | 8 | 1.00 | -7.00 | Divergent |
adobe.com | PDF editor | 11 | 1.00 | -10.00 | Divergent |
lastpass.com | Password manager | 19 | 5.75 | -13.25 | Divergent |